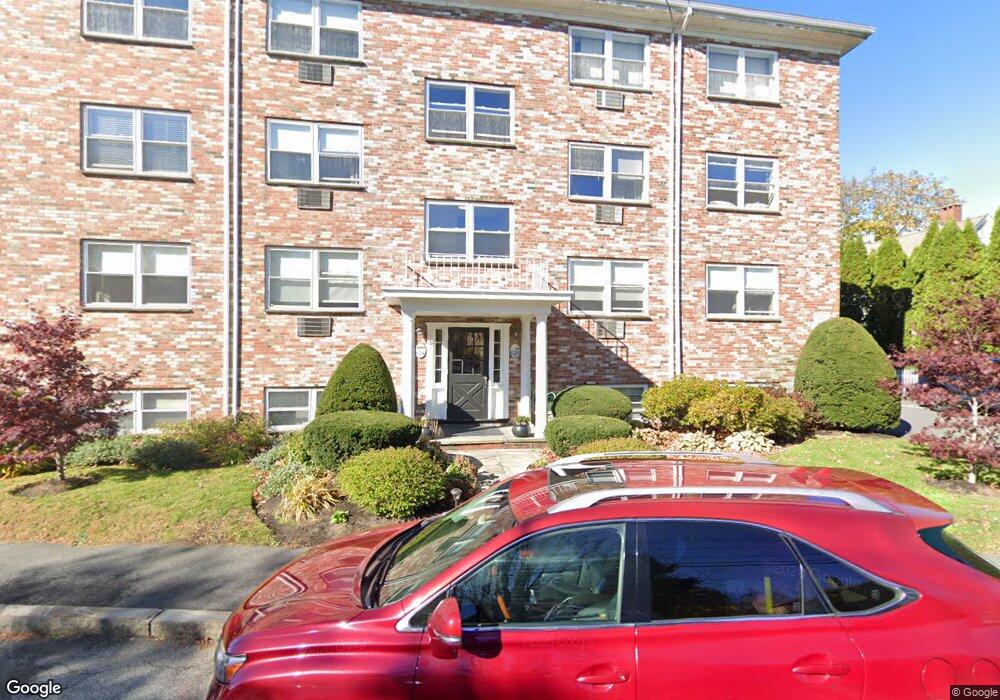
59 Prospect St Unit D1 Marblehead, MA 01945
Estimated Value: $362,000 - $558,000
2
Beds
1
Bath
720
Sq Ft
$585/Sq Ft
Est. Value
About This Home
This home is located at 59 Prospect St Unit D1, Marblehead, MA 01945 and is currently estimated at $421,247, approximately $585 per square foot. 59 Prospect St Unit D1 is a home located in Essex County with nearby schools including Marblehead High School, Marblehead Community Charter Public School, and Devereux School.
Ownership History
Date
Name
Owned For
Owner Type
Purchase Details
Closed on
May 1, 1995
Sold by
Robbins Pamela A
Bought by
Perry Judith L
Current Estimated Value
Purchase Details
Closed on
Aug 7, 1991
Sold by
Garden Mgmt Co
Bought by
Robbins Pamela A
Create a Home Valuation Report for This Property
The Home Valuation Report is an in-depth analysis detailing your home's value as well as a comparison with similar homes in the area
Home Values in the Area
Average Home Value in this Area
Purchase History
| Date | Buyer | Sale Price | Title Company |
|---|---|---|---|
| Perry Judith L | $83,000 | -- | |
| Robbins Pamela A | $75,000 | -- |
Source: Public Records
Mortgage History
| Date | Status | Borrower | Loan Amount |
|---|---|---|---|
| Closed | Robbins Pamela A | $0 |
Source: Public Records
Tax History
| Year | Tax Paid | Tax Assessment Tax Assessment Total Assessment is a certain percentage of the fair market value that is determined by local assessors to be the total taxable value of land and additions on the property. | Land | Improvement |
|---|---|---|---|---|
| 2025 | $3,072 | $339,500 | $0 | $339,500 |
| 2024 | $2,686 | $299,800 | $0 | $299,800 |
| 2023 | $2,752 | $275,200 | $0 | $275,200 |
| 2022 | $2,801 | $266,300 | $0 | $266,300 |
| 2021 | $3,031 | $290,900 | $0 | $290,900 |
| 2020 | $2,909 | $280,000 | $0 | $280,000 |
| 2019 | $1,702 | $158,500 | $0 | $158,500 |
| 2018 | $1,747 | $158,500 | $0 | $158,500 |
| 2017 | $1,745 | $158,500 | $0 | $158,500 |
| 2016 | $1,671 | $150,500 | $0 | $150,500 |
| 2015 | $1,580 | $142,600 | $0 | $142,600 |
| 2014 | $1,630 | $147,000 | $0 | $147,000 |
Source: Public Records
Map
Nearby Homes
- 290 Washington St Unit A
- 23 Wyman Rd
- 6 Mount Vernon St
- 55 Brackett Place Unit B
- 30 Haley Rd Unit 1
- 70 Maverick St
- 66 Pleasant St Unit 1
- 66 Pleasant St Unit 2
- 132 Elm St
- 132 Elm St Unit 132
- 282 Pleasant St
- 26 Summer St Unit 1
- 45 Pleasant St
- 9 Darling St
- 4 Gallison Ave
- 3 Frost Ln Unit 1
- 7 Mechanic Ct
- 1 Knollwood Rd
- 4 Dean Rd
- 4 Ballast Ln
- 59 Prospect St Unit D4
- 59 Prospect St Unit D3
- 59 Prospect St Unit D2
- 59 Prospect St Unit C4
- 59 Prospect St Unit C3
- 59 Prospect St Unit C2
- 59 Prospect St Unit C1
- 59 Prospect St Unit B4
- 59 Prospect St Unit B3
- 59 Prospect St Unit B1
- 59 Prospect St Unit A4
- 59 Prospect St Unit A3
- 59 Prospect St Unit A2
- 59 Prospect St Unit A1
- 59 Prospect St Unit 2C
- 59 Prospect St Unit c104
- 54 Rowland St
- 52 Rowland St Unit 2
- 52 Rowland St Unit 1
- 55 Rowland St
Your Personal Tour Guide
Ask me questions while you tour the home.