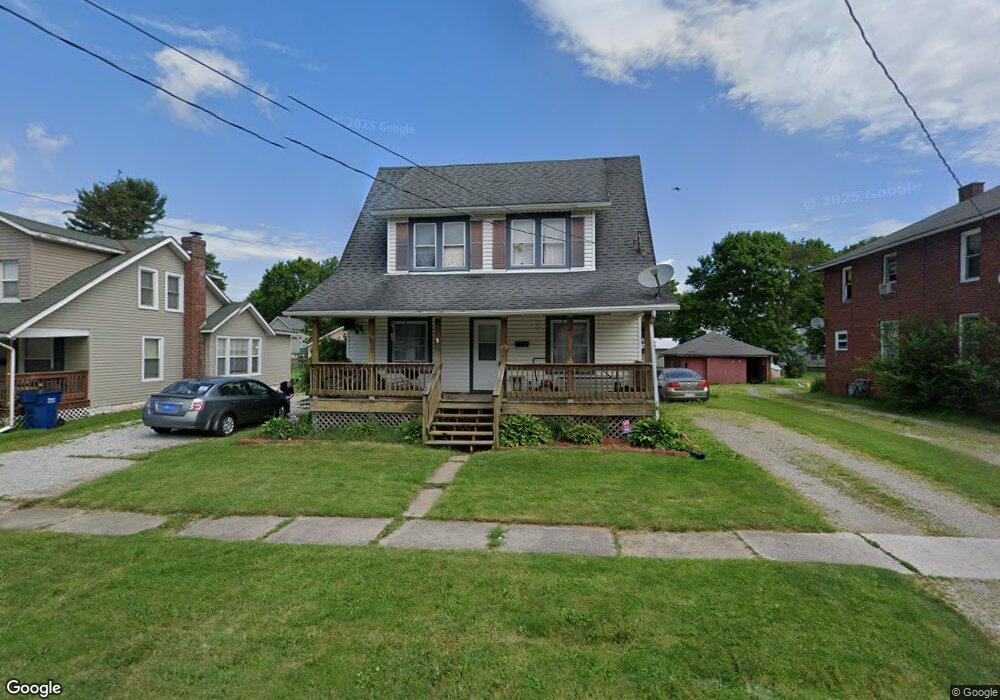
59 Raymond Ave Shelby, OH 44875
Estimated Value: $134,000 - $196,000
4
Beds
2
Baths
1,792
Sq Ft
$94/Sq Ft
Est. Value
About This Home
This home is located at 59 Raymond Ave, Shelby, OH 44875 and is currently estimated at $167,685, approximately $93 per square foot. 59 Raymond Ave is a home located in Richland County with nearby schools including St. Mary's School.
Ownership History
Date
Name
Owned For
Owner Type
Purchase Details
Closed on
Mar 3, 2005
Sold by
Flaherty Jeffrey S and Flaherty Michelle R
Bought by
Beck Scott W and Beck Deborah K
Current Estimated Value
Home Financials for this Owner
Home Financials are based on the most recent Mortgage that was taken out on this home.
Original Mortgage
$86,148
Outstanding Balance
$43,848
Interest Rate
5.67%
Mortgage Type
FHA
Estimated Equity
$123,837
Purchase Details
Closed on
Feb 23, 2000
Sold by
Neeley Lori A
Bought by
Flaherty James
Home Financials for this Owner
Home Financials are based on the most recent Mortgage that was taken out on this home.
Original Mortgage
$72,675
Interest Rate
8.21%
Mortgage Type
New Conventional
Purchase Details
Closed on
Jul 9, 1998
Sold by
Mcclarren Mary Lou
Bought by
Neeley Lori A
Home Financials for this Owner
Home Financials are based on the most recent Mortgage that was taken out on this home.
Original Mortgage
$61,000
Interest Rate
7.25%
Mortgage Type
New Conventional
Create a Home Valuation Report for This Property
The Home Valuation Report is an in-depth analysis detailing your home's value as well as a comparison with similar homes in the area
Home Values in the Area
Average Home Value in this Area
Purchase History
| Date | Buyer | Sale Price | Title Company |
|---|---|---|---|
| Beck Scott W | $87,500 | Southern Title | |
| Flaherty James | $76,500 | -- | |
| Neeley Lori A | $70,000 | -- |
Source: Public Records
Mortgage History
| Date | Status | Borrower | Loan Amount |
|---|---|---|---|
| Open | Beck Scott W | $86,148 | |
| Closed | Flaherty James | $72,675 | |
| Previous Owner | Neeley Lori A | $61,000 |
Source: Public Records
Tax History Compared to Growth
Tax History
| Year | Tax Paid | Tax Assessment Tax Assessment Total Assessment is a certain percentage of the fair market value that is determined by local assessors to be the total taxable value of land and additions on the property. | Land | Improvement |
|---|---|---|---|---|
| 2024 | $1,495 | $39,100 | $5,310 | $33,790 |
| 2023 | $1,495 | $39,100 | $5,310 | $33,790 |
| 2022 | $1,422 | $33,240 | $5,370 | $27,870 |
| 2021 | $1,422 | $33,240 | $5,370 | $27,870 |
| 2020 | $1,423 | $33,240 | $5,370 | $27,870 |
| 2019 | $1,315 | $28,170 | $4,550 | $23,620 |
| 2018 | $1,302 | $28,170 | $4,550 | $23,620 |
| 2017 | $1,243 | $28,170 | $4,550 | $23,620 |
| 2016 | $1,196 | $26,310 | $3,690 | $22,620 |
| 2015 | $1,190 | $26,310 | $3,690 | $22,620 |
| 2014 | $1,149 | $26,310 | $3,690 | $22,620 |
| 2012 | $595 | $27,700 | $3,890 | $23,810 |
Source: Public Records
Map
Nearby Homes