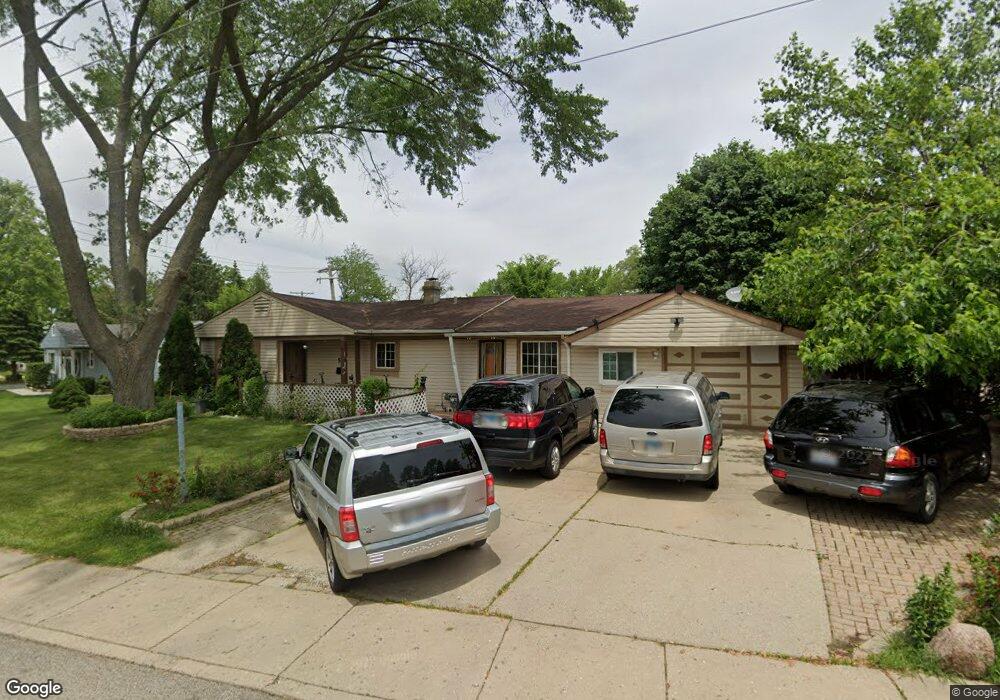
59 Robin Rd Carpentersville, IL 60110
Estimated Value: $252,000 - $290,000
3
Beds
--
Bath
1,580
Sq Ft
$170/Sq Ft
Est. Value
About This Home
This home is located at 59 Robin Rd, Carpentersville, IL 60110 and is currently estimated at $268,464, approximately $169 per square foot. 59 Robin Rd is a home located in Kane County with nearby schools including Meadowdale Elementary School, Carpentersville Middle School, and Dundee-Crown High School.
Ownership History
Date
Name
Owned For
Owner Type
Purchase Details
Closed on
Feb 2, 2005
Sold by
Ortega Jose and Martinez Ediberto
Bought by
Ortega Luis
Current Estimated Value
Home Financials for this Owner
Home Financials are based on the most recent Mortgage that was taken out on this home.
Original Mortgage
$124,800
Interest Rate
5.64%
Mortgage Type
New Conventional
Purchase Details
Closed on
Jul 26, 2002
Sold by
Rosario Norma and Negron Otoniel Perez
Bought by
Ortega Jose and Martinez Ediberto
Home Financials for this Owner
Home Financials are based on the most recent Mortgage that was taken out on this home.
Original Mortgage
$126,022
Interest Rate
6.56%
Mortgage Type
FHA
Purchase Details
Closed on
Jul 19, 1996
Sold by
Edwardsen La Verne
Bought by
Rosario Norma and Negron Otoniel Perez
Home Financials for this Owner
Home Financials are based on the most recent Mortgage that was taken out on this home.
Original Mortgage
$92,229
Interest Rate
8.31%
Mortgage Type
FHA
Create a Home Valuation Report for This Property
The Home Valuation Report is an in-depth analysis detailing your home's value as well as a comparison with similar homes in the area
Home Values in the Area
Average Home Value in this Area
Purchase History
| Date | Buyer | Sale Price | Title Company |
|---|---|---|---|
| Ortega Luis | -- | Citywide Title Corporation | |
| Ortega Jose | $128,000 | -- | |
| Rosario Norma | $93,000 | -- |
Source: Public Records
Mortgage History
| Date | Status | Borrower | Loan Amount |
|---|---|---|---|
| Closed | Ortega Luis | $124,800 | |
| Closed | Ortega Jose | $126,022 | |
| Previous Owner | Rosario Norma | $92,229 |
Source: Public Records
Tax History Compared to Growth
Tax History
| Year | Tax Paid | Tax Assessment Tax Assessment Total Assessment is a certain percentage of the fair market value that is determined by local assessors to be the total taxable value of land and additions on the property. | Land | Improvement |
|---|---|---|---|---|
| 2024 | $5,244 | $77,242 | $12,553 | $64,689 |
| 2023 | $5,167 | $69,500 | $11,295 | $58,205 |
| 2022 | $4,730 | $62,581 | $11,295 | $51,286 |
| 2021 | $4,616 | $59,089 | $10,665 | $48,424 |
| 2020 | $4,538 | $57,760 | $10,425 | $47,335 |
| 2019 | $4,433 | $54,832 | $9,897 | $44,935 |
| 2018 | $3,955 | $45,849 | $9,701 | $36,148 |
| 2017 | $3,784 | $42,890 | $9,075 | $33,815 |
| 2016 | $3,388 | $36,795 | $8,787 | $28,008 |
| 2015 | $2,128 | $28,599 | $8,234 | $20,365 |
| 2014 | $2,128 | $25,688 | $8,007 | $17,681 |
| 2013 | $2,128 | $26,474 | $8,252 | $18,222 |
Source: Public Records
Map
Nearby Homes