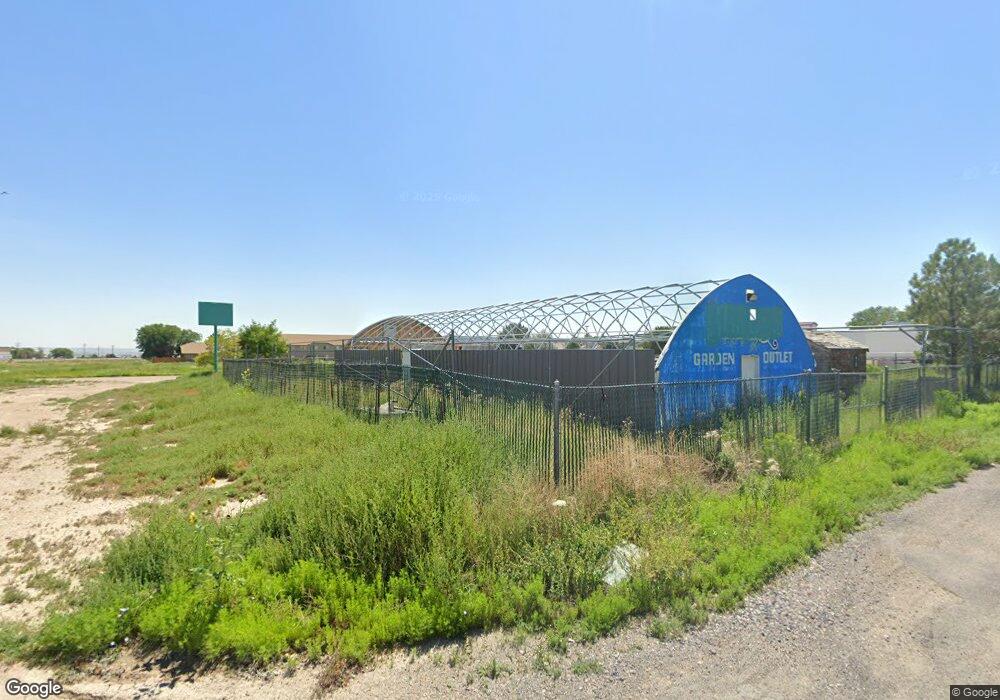
59 S Masters Dr Pueblo West, CO 81007
Estimated Value: $309,944
--
Bed
--
Bath
2,400
Sq Ft
$129/Sq Ft
Est. Value
About This Home
This home is located at 59 S Masters Dr, Pueblo West, CO 81007 and is currently estimated at $309,944, approximately $129 per square foot. 59 S Masters Dr is a home located in Pueblo County with nearby schools including Liberty Point Elementary School, Liberty Point International School, and Pueblo West High School.
Ownership History
Date
Name
Owned For
Owner Type
Purchase Details
Closed on
Nov 2, 2020
Sold by
Brady Brothers Llc
Bought by
Jkmmc Llc
Current Estimated Value
Home Financials for this Owner
Home Financials are based on the most recent Mortgage that was taken out on this home.
Original Mortgage
$100,000
Outstanding Balance
$88,986
Interest Rate
2.8%
Mortgage Type
Commercial
Estimated Equity
$220,958
Purchase Details
Closed on
Feb 11, 2015
Sold by
Apple Valley Greenhouses Partnership
Bought by
Brady Brothers Llc
Home Financials for this Owner
Home Financials are based on the most recent Mortgage that was taken out on this home.
Original Mortgage
$125,000
Interest Rate
3.92%
Mortgage Type
Commercial
Purchase Details
Closed on
Feb 21, 1996
Sold by
Pueblo West Metro Dist
Bought by
Apple Valley Greenhouses
Purchase Details
Closed on
Dec 29, 1992
Bought by
Pueblo West Metro Dist
Create a Home Valuation Report for This Property
The Home Valuation Report is an in-depth analysis detailing your home's value as well as a comparison with similar homes in the area
Home Values in the Area
Average Home Value in this Area
Purchase History
| Date | Buyer | Sale Price | Title Company |
|---|---|---|---|
| Jkmmc Llc | $125,000 | None Available | |
| Brady Brothers Llc | $125,000 | Waranty Title Inc | |
| Apple Valley Greenhouses | $5,000 | -- | |
| Pueblo West Metro Dist | -- | -- |
Source: Public Records
Mortgage History
| Date | Status | Borrower | Loan Amount |
|---|---|---|---|
| Open | Jkmmc Llc | $100,000 | |
| Previous Owner | Brady Brothers Llc | $125,000 |
Source: Public Records
Tax History Compared to Growth
Tax History
| Year | Tax Paid | Tax Assessment Tax Assessment Total Assessment is a certain percentage of the fair market value that is determined by local assessors to be the total taxable value of land and additions on the property. | Land | Improvement |
|---|---|---|---|---|
| 2024 | $252 | $2,520 | -- | -- |
| 2023 | $255 | $10,890 | $6,930 | $3,960 |
| 2022 | $1,325 | $13,340 | $7,200 | $6,140 |
| 2021 | $1,065 | $10,760 | $6,310 | $4,450 |
| 2020 | $990 | $9,980 | $6,310 | $3,670 |
| 2019 | $988 | $9,981 | $6,315 | $3,666 |
| 2018 | $979 | $9,890 | $6,315 | $3,575 |
| 2017 | $981 | $9,890 | $6,315 | $3,575 |
| 2016 | $963 | $9,701 | $6,315 | $3,386 |
| 2015 | $955 | $9,701 | $6,315 | $3,386 |
| 2014 | $476 | $9,665 | $6,315 | $3,350 |
Source: Public Records
Map
Nearby Homes
- LOT 39 Swallows Rd
- 142 E Croyden Dr
- 151 S Casa Monterey Way
- 161 E Croyden Dr
- TBD 0
- 47 S Jibbsam Way
- 162 S Del Monte Place
- 8 S Glenrose Dr
- 56 E Industrial Blvd
- 77 E Industrial Blvd
- 83 E Industrial Blvd
- 152 W Glenrose Dr
- 91 E Industrial Blvd
- 213 S Dacona Dr
- 242 W Calle de Camelia Dr
- 42 E Assembly Dr
- 192 S Golfview Dr
- 46 E Assembly Dr
- 50 E Assembly Dr
- 228 S Caddoa Dr
- 71 S Masters Dr Unit 12
- 66 S Masters Dr Unit 7
- 60 S Masters Dr Unit 8
- 77 S Masters Dr Unit 13
- 77 S Masters Dr
- 51 S Masters Dr Unit 9
- 51 S Masters Dr
- 87 S Masters Dr Unit 14
- 87 S Masters Dr
- 84 S Masters Dr
- 72 S Masters Dr Unit 6
- 88 S Masters Dr
- 80 E Dunlap Unit 11
- 80 E Dunlop Dr Unit 11
- 42 S Masters Dr Unit 10
- 79 E Spaulding Ave Unit 1
- 44 E Spaulding Ave
- 56-70 S Radnor Dr Unit 14
- 56-70 S Radnor Dr Unit 12*
- 70 E Spaulding Ave