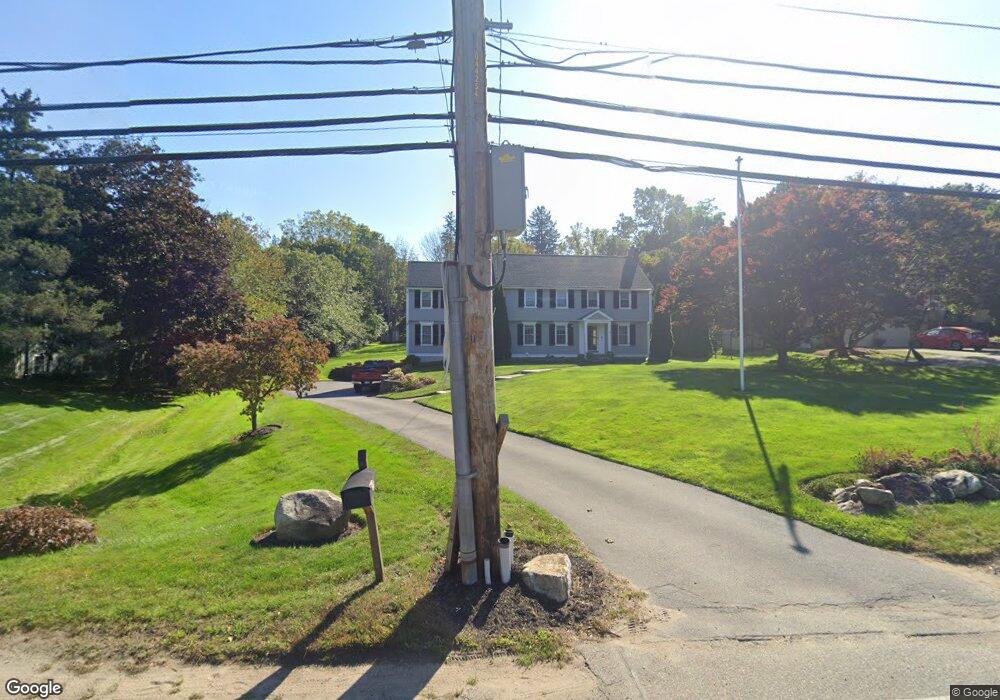
59 Salem St North Andover, MA 01845
Estimated Value: $997,000 - $1,235,000
4
Beds
3
Baths
2,600
Sq Ft
$407/Sq Ft
Est. Value
About This Home
This home is located at 59 Salem St, North Andover, MA 01845 and is currently estimated at $1,057,225, approximately $406 per square foot. 59 Salem St is a home located in Essex County with nearby schools including Franklin Elementary School, North Andover Middle School, and North Andover High School.
Ownership History
Date
Name
Owned For
Owner Type
Purchase Details
Closed on
Jan 30, 2018
Sold by
Johnson Glen D and Johnson Catherine M
Bought by
59 Salem Street Rt
Current Estimated Value
Purchase Details
Closed on
Aug 25, 2003
Sold by
Willis Jeanne M and Willis John F
Bought by
Johnson Catherine M and Johnson Glen D
Home Financials for this Owner
Home Financials are based on the most recent Mortgage that was taken out on this home.
Original Mortgage
$322,700
Interest Rate
5.52%
Mortgage Type
Purchase Money Mortgage
Purchase Details
Closed on
Jul 27, 1989
Sold by
Reese Charles
Bought by
Willis John
Home Financials for this Owner
Home Financials are based on the most recent Mortgage that was taken out on this home.
Original Mortgage
$187,600
Interest Rate
9.9%
Mortgage Type
Purchase Money Mortgage
Create a Home Valuation Report for This Property
The Home Valuation Report is an in-depth analysis detailing your home's value as well as a comparison with similar homes in the area
Home Values in the Area
Average Home Value in this Area
Purchase History
| Date | Buyer | Sale Price | Title Company |
|---|---|---|---|
| 59 Salem Street Rt | -- | -- | |
| Johnson Catherine M | $574,000 | -- | |
| Willis John | $265,000 | -- |
Source: Public Records
Mortgage History
| Date | Status | Borrower | Loan Amount |
|---|---|---|---|
| Previous Owner | Willis John | $315,000 | |
| Previous Owner | Johnson Catherine M | $322,700 | |
| Previous Owner | Willis John | $40,000 | |
| Previous Owner | Willis John | $186,000 | |
| Previous Owner | Willis John | $187,600 |
Source: Public Records
Tax History Compared to Growth
Tax History
| Year | Tax Paid | Tax Assessment Tax Assessment Total Assessment is a certain percentage of the fair market value that is determined by local assessors to be the total taxable value of land and additions on the property. | Land | Improvement |
|---|---|---|---|---|
| 2025 | $9,507 | $844,300 | $393,700 | $450,600 |
| 2024 | $9,037 | $814,900 | $373,000 | $441,900 |
| 2023 | $8,617 | $704,000 | $315,000 | $389,000 |
| 2022 | $8,201 | $606,100 | $273,500 | $332,600 |
| 2021 | $7,869 | $555,300 | $248,700 | $306,600 |
| 2020 | $7,543 | $549,000 | $242,400 | $306,600 |
| 2019 | $7,362 | $549,000 | $242,400 | $306,600 |
| 2018 | $7,977 | $549,000 | $242,400 | $306,600 |
| 2017 | $7,454 | $522,000 | $222,500 | $299,500 |
| 2016 | $7,118 | $498,800 | $224,700 | $274,100 |
| 2015 | $6,966 | $484,100 | $207,400 | $276,700 |
Source: Public Records
Map
Nearby Homes
- 479 Stevens St
- 3 Great Pond Rd
- 174 Chestnut St Unit 14
- 80 Sandra Ln
- 124 Quail Run Rd
- 136 Quail Run Rd
- 378 Salem St
- 116 Mill Pond
- 115 Mill Pond
- 112 Mill Pond
- 180 Chickering Rd Unit 310C
- 98 Mill Pond
- 19 Fernview Ave Unit 6
- 19 Fernview Ave Unit 5
- 25 Fernview Ave Unit 8
- 23 Fernview Ave Unit 1
- 40 Fernview Ave Unit 11
- 16 Court St
- 35 Fernview Ave Unit 5
- 52 Fernview Ave Unit 7