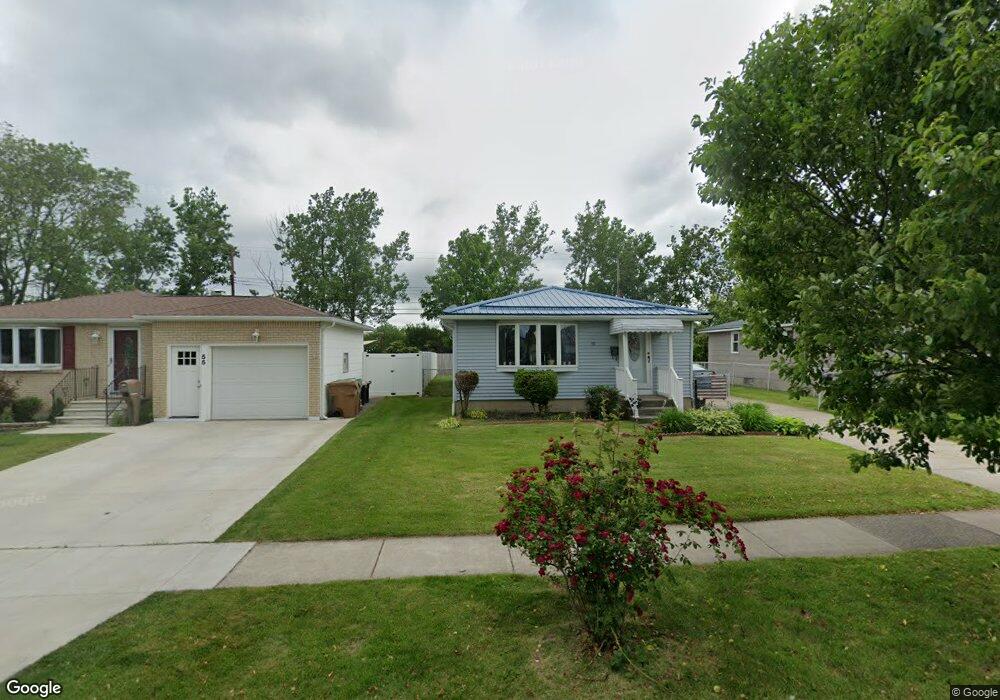
59 Sandy Ln Buffalo, NY 14227
South Cheektowaga NeighborhoodEstimated Value: $206,000 - $258,000
3
Beds
1
Bath
1,092
Sq Ft
$217/Sq Ft
Est. Value
About This Home
This home is located at 59 Sandy Ln, Buffalo, NY 14227 and is currently estimated at $236,823, approximately $216 per square foot. 59 Sandy Ln is a home located in Erie County with nearby schools including Union East Elementary School, Cheektowaga Middle School, and Cheektowaga High School.
Ownership History
Date
Name
Owned For
Owner Type
Purchase Details
Closed on
Aug 28, 2007
Sold by
Martel Gerald E
Bought by
Martel Gerald E and Martel Carol Ann
Current Estimated Value
Purchase Details
Closed on
Nov 9, 2006
Sold by
Enzinna Nicole M
Bought by
Martel Gerald E
Home Financials for this Owner
Home Financials are based on the most recent Mortgage that was taken out on this home.
Original Mortgage
$76,800
Outstanding Balance
$45,683
Interest Rate
6.31%
Mortgage Type
Purchase Money Mortgage
Estimated Equity
$191,140
Purchase Details
Closed on
May 24, 1999
Sold by
Korba James
Bought by
Maxwell Darren J and Maxwell Elaine M
Create a Home Valuation Report for This Property
The Home Valuation Report is an in-depth analysis detailing your home's value as well as a comparison with similar homes in the area
Home Values in the Area
Average Home Value in this Area
Purchase History
| Date | Buyer | Sale Price | Title Company |
|---|---|---|---|
| Martel Gerald E | -- | None Available | |
| Martel Gerald E | $96,000 | None Available | |
| Maxwell Darren J | $76,000 | -- |
Source: Public Records
Mortgage History
| Date | Status | Borrower | Loan Amount |
|---|---|---|---|
| Open | Martel Gerald E | $76,800 |
Source: Public Records
Tax History
| Year | Tax Paid | Tax Assessment Tax Assessment Total Assessment is a certain percentage of the fair market value that is determined by local assessors to be the total taxable value of land and additions on the property. | Land | Improvement |
|---|---|---|---|---|
| 2024 | $5,311 | $166,000 | $16,400 | $149,600 |
| 2023 | $5,061 | $166,000 | $16,400 | $149,600 |
| 2022 | $4,890 | $166,000 | $16,400 | $149,600 |
| 2021 | $4,779 | $144,000 | $16,400 | $127,600 |
| 2020 | $3,077 | $95,000 | $12,100 | $82,900 |
| 2019 | $2,763 | $95,000 | $12,100 | $82,900 |
| 2018 | $2,876 | $95,000 | $12,100 | $82,900 |
| 2017 | $2,267 | $95,000 | $12,100 | $82,900 |
| 2016 | $2,732 | $95,000 | $12,100 | $82,900 |
| 2015 | -- | $95,000 | $12,100 | $82,900 |
| 2014 | -- | $91,900 | $12,100 | $79,800 |
Source: Public Records
Map
Nearby Homes
- 75 Fairoaks Ln
- 73 Fairoaks Ln
- 40 Marie Ave
- 60 Constance Ln
- 20 Fairoaks Ln
- 79 Raymond Ave
- 104 Starlite Ave
- 83 Patricia Ln
- 428 Kennedy Rd
- 27 Lemoine Ave
- 83 Lemoine Ave
- 12 Brookfield Ln Unit 6
- 45 Wallace Ave
- 16 Wallace Ave
- 52 Rushford Hollow Dr
- 104 Iroquois Ave
- 27 Edmund St
- 30 Jane Dr
- 2445 William St
- 68 Walden Ave
Your Personal Tour Guide
Ask me questions while you tour the home.