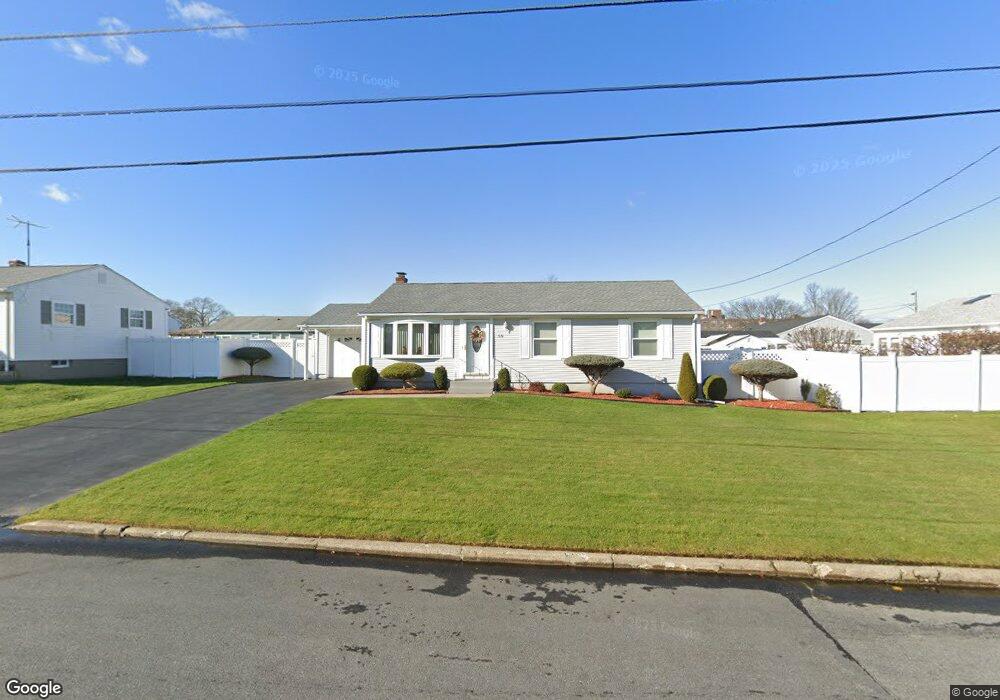
59 Seabrook Dr East Providence, RI 02914
Outer East Bay NeighborhoodEstimated Value: $429,320 - $506,000
3
Beds
1
Bath
1,280
Sq Ft
$365/Sq Ft
Est. Value
About This Home
This home is located at 59 Seabrook Dr, East Providence, RI 02914 and is currently estimated at $467,080, approximately $364 per square foot. 59 Seabrook Dr is a home located in Providence County with nearby schools including East Providence High School, The Gordon School, and Ocean State Montessori School.
Ownership History
Date
Name
Owned For
Owner Type
Purchase Details
Closed on
Mar 14, 2022
Sold by
Escobar Jose S and Escobar Maria C
Bought by
Escobar Jose S and Escobar Maria C
Current Estimated Value
Purchase Details
Closed on
Feb 9, 2022
Sold by
Escobar Jose C and Escobar Maria C
Bought by
Escobar Jose C and Escobar Maria C
Purchase Details
Closed on
Feb 15, 2002
Sold by
Panzarella Richard D
Bought by
Escobar Jose S and Escobar Maria
Purchase Details
Closed on
Oct 19, 1994
Sold by
Panzarella Richard D and Panzarella Edward J
Bought by
Panzarella Richard D
Create a Home Valuation Report for This Property
The Home Valuation Report is an in-depth analysis detailing your home's value as well as a comparison with similar homes in the area
Home Values in the Area
Average Home Value in this Area
Purchase History
| Date | Buyer | Sale Price | Title Company |
|---|---|---|---|
| Escobar Jose S | -- | None Available | |
| Escobar Jose C | -- | None Available | |
| Escobar Jose S | $172,000 | -- | |
| Panzarella Richard D | $58,000 | -- |
Source: Public Records
Tax History Compared to Growth
Tax History
| Year | Tax Paid | Tax Assessment Tax Assessment Total Assessment is a certain percentage of the fair market value that is determined by local assessors to be the total taxable value of land and additions on the property. | Land | Improvement |
|---|---|---|---|---|
| 2024 | $5,056 | $329,800 | $101,500 | $228,300 |
| 2023 | $4,868 | $329,800 | $101,500 | $228,300 |
| 2022 | $5,102 | $233,400 | $57,500 | $175,900 |
| 2021 | $5,018 | $233,400 | $57,500 | $175,900 |
| 2020 | $4,806 | $233,400 | $57,500 | $175,900 |
| 2019 | $4,673 | $233,400 | $57,500 | $175,900 |
| 2018 | $4,649 | $203,200 | $50,400 | $152,800 |
| 2017 | $4,546 | $203,200 | $50,400 | $152,800 |
| 2016 | $4,523 | $203,200 | $50,400 | $152,800 |
| 2015 | $4,409 | $192,100 | $51,800 | $140,300 |
| 2014 | $4,409 | $192,100 | $51,800 | $140,300 |
Source: Public Records
Map
Nearby Homes
- 74 Brookhaven Dr
- 62 Valleybrook Dr
- 180 Grassmere Ave
- 34 Ridge Dr
- 82 Martin St
- 23 Martin St
- 164 Brightridge Ave
- 25 Fairview Ave
- 109 Bliss St
- 1402 S Broadway
- 1123 S Broadway
- 25 Ide Ave
- 29 Ide Ave
- 81 Hazelwood Ave
- 1463 S Broadway
- 400 Juniper St Unit C
- 400 Juniper St Unit B
- 400 Juniper St Unit A
- 78 Ingraham St
- 17 Brown St Unit 19