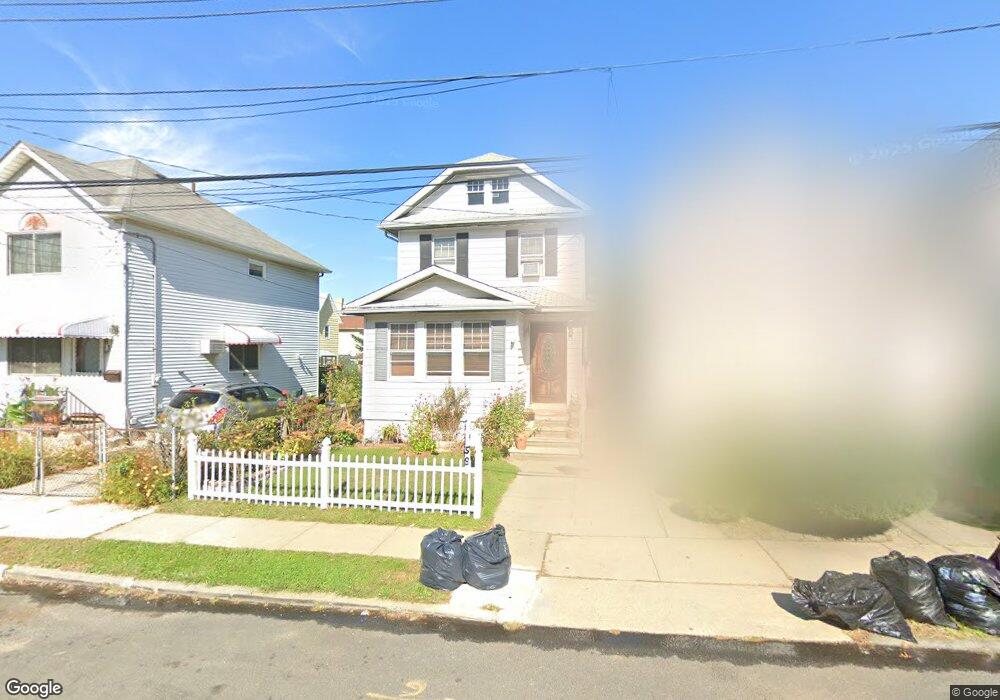
59 Seneca St Staten Island, NY 10310
West Brighton NeighborhoodEstimated Value: $588,646 - $665,000
3
Beds
1
Bath
1,944
Sq Ft
$316/Sq Ft
Est. Value
About This Home
This home is located at 59 Seneca St, Staten Island, NY 10310 and is currently estimated at $614,662, approximately $316 per square foot. 59 Seneca St is a home located in Richmond County with nearby schools including P.S. 45 John Tyler, Intermediate School 27, and Susan E Wagner High School.
Ownership History
Date
Name
Owned For
Owner Type
Purchase Details
Closed on
Jul 30, 2001
Sold by
Federal National Mortgage Association
Bought by
Lanasa Francis Marvella Y and Lanasa Reid
Current Estimated Value
Home Financials for this Owner
Home Financials are based on the most recent Mortgage that was taken out on this home.
Original Mortgage
$159,600
Outstanding Balance
$61,807
Interest Rate
7.05%
Mortgage Type
Purchase Money Mortgage
Estimated Equity
$552,855
Create a Home Valuation Report for This Property
The Home Valuation Report is an in-depth analysis detailing your home's value as well as a comparison with similar homes in the area
Home Values in the Area
Average Home Value in this Area
Purchase History
| Date | Buyer | Sale Price | Title Company |
|---|---|---|---|
| Lanasa Francis Marvella Y | $168,000 | -- |
Source: Public Records
Mortgage History
| Date | Status | Borrower | Loan Amount |
|---|---|---|---|
| Open | Lanasa Francis Marvella Y | $159,600 |
Source: Public Records
Tax History Compared to Growth
Tax History
| Year | Tax Paid | Tax Assessment Tax Assessment Total Assessment is a certain percentage of the fair market value that is determined by local assessors to be the total taxable value of land and additions on the property. | Land | Improvement |
|---|---|---|---|---|
| 2025 | $4,447 | $36,660 | $6,902 | $29,758 |
| 2024 | $4,459 | $29,940 | $7,972 | $21,968 |
| 2023 | $4,179 | $22,208 | $7,738 | $14,470 |
| 2022 | $3,896 | $26,460 | $10,140 | $16,320 |
| 2021 | $4,106 | $25,200 | $10,140 | $15,060 |
| 2020 | $4,105 | $25,380 | $10,140 | $15,240 |
| 2019 | $3,811 | $24,420 | $10,140 | $14,280 |
| 2018 | $3,475 | $18,507 | $8,296 | $10,211 |
| 2017 | $3,260 | $17,460 | $10,140 | $7,320 |
| 2016 | $3,540 | $19,257 | $9,686 | $9,571 |
| 2015 | $2,984 | $18,168 | $9,541 | $8,627 |
| 2014 | $2,984 | $17,140 | $10,038 | $7,102 |
Source: Public Records
Map
Nearby Homes
- 361 Broadway
- 56 South St
- 386 N Burgher Ave
- 305 Broadway
- 1064 Castleton Ave
- 1001 Castleton Ave
- 943 Castleton Ave
- 46 Winegar Ln
- 46 Elizabeth St
- 657 Delafield Ave
- 123 Roe St
- 582 Cary Ave
- 335 Oakland Ave
- 331 Oakland Ave
- 432 Pelton Ave
- 718 Henderson Ave
- 698 Henderson Ave
- 77 Barker St
- 1198 Castleton Ave
- 704 Delafield Ave