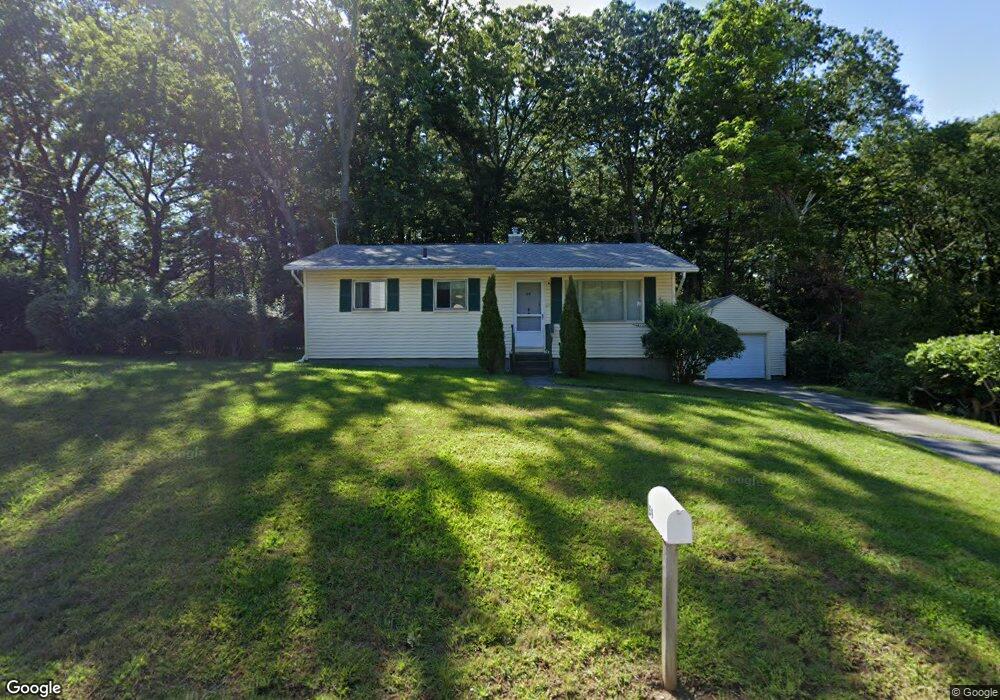
59 Shady Lane Ave Northborough, MA 01532
Estimated Value: $441,000 - $495,473
2
Beds
1
Bath
864
Sq Ft
$546/Sq Ft
Est. Value
About This Home
This home is located at 59 Shady Lane Ave, Northborough, MA 01532 and is currently estimated at $471,618, approximately $545 per square foot. 59 Shady Lane Ave is a home located in Worcester County with nearby schools including Lincoln Street Elementary School, Robert E. Melican Middle School, and Algonquin Regional High School.
Ownership History
Date
Name
Owned For
Owner Type
Purchase Details
Closed on
Jul 28, 2020
Sold by
R F Johnson Ft 1992
Bought by
Johnson Heidi M
Current Estimated Value
Purchase Details
Closed on
Jul 31, 2018
Sold by
Johnson Richard F
Bought by
Richard F Johnson Ft 1
Purchase Details
Closed on
Nov 18, 2015
Sold by
Johnson Rt and Johnson Richard F
Bought by
Johnson Richard F
Create a Home Valuation Report for This Property
The Home Valuation Report is an in-depth analysis detailing your home's value as well as a comparison with similar homes in the area
Home Values in the Area
Average Home Value in this Area
Purchase History
| Date | Buyer | Sale Price | Title Company |
|---|---|---|---|
| Johnson Heidi M | -- | None Available | |
| Richard F Johnson Ft 1 | -- | -- | |
| Johnson Richard F | -- | -- |
Source: Public Records
Tax History Compared to Growth
Tax History
| Year | Tax Paid | Tax Assessment Tax Assessment Total Assessment is a certain percentage of the fair market value that is determined by local assessors to be the total taxable value of land and additions on the property. | Land | Improvement |
|---|---|---|---|---|
| 2025 | $6,183 | $433,900 | $257,000 | $176,900 |
| 2024 | $5,416 | $379,300 | $213,000 | $166,300 |
| 2023 | $5,458 | $369,000 | $201,100 | $167,900 |
| 2022 | $5,389 | $326,800 | $191,400 | $135,400 |
| 2021 | $5,138 | $300,100 | $173,900 | $126,200 |
| 2020 | $5,166 | $299,500 | $173,900 | $125,600 |
| 2019 | $4,917 | $286,700 | $168,700 | $118,000 |
| 2018 | $4,674 | $268,800 | $165,100 | $103,700 |
| 2017 | $4,539 | $261,000 | $165,100 | $95,900 |
| 2016 | $4,396 | $256,000 | $161,800 | $94,200 |
| 2015 | $4,064 | $242,900 | $164,200 | $78,700 |
| 2014 | $3,915 | $236,000 | $164,200 | $71,800 |
Source: Public Records
Map
Nearby Homes
- 105 Lincoln St
- 19 Crestwood Dr Unit 19
- 132 W Main St
- 89 W Main St
- 39 Pleasant St Unit B19
- 39 Pleasant St Unit C5
- 90 W Main St
- 139 Davis St
- 198 South St
- 185-187 South St
- 81 West St
- 223 South St
- 71 Summer St
- 5 Swan View Common Dr
- 1 Hamilton Rd
- 59 School St Unit A-14
- 349 Brigham St
- 86 Whitney St
- 209 North St
- 85 Hudson St Unit 85
- 51 Shady Lane Ave
- 63 Shady Lane Ave
- 20 Sunny Hill Rd
- 47 Shady Lane Ave
- 64 Shady Lane Ave
- 67 Oak Ave
- 19 Sunny Hill Rd
- 43 Shady Lane Ave
- 16 Sunny Hill Rd
- 18 Jay Ave
- 68 Shady Lane Ave
- 15 Sunnyhill Rd
- 15 Sunny Hill Rd
- 68 Shady Ln
- 65 Oak Ave
- 25 Leland Ave
- 22 Leland Ave
- 12 Sunny Hill Rd
- 14 Jay Ave
- 39 Shady Lane Ave