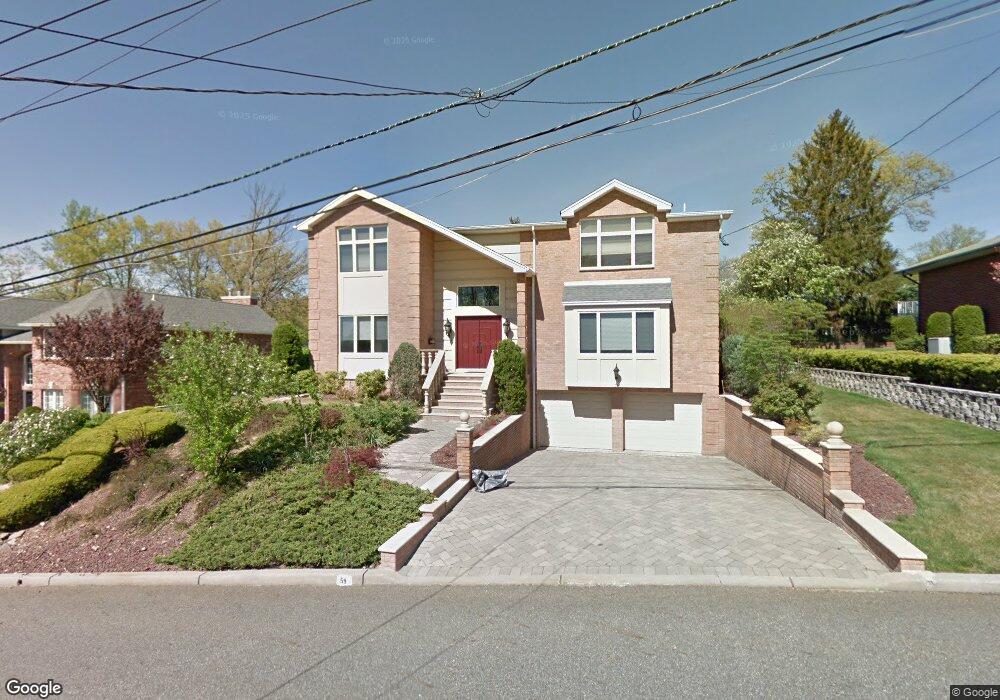
59 Sherwood Ave Englewood Cliffs, NJ 07632
Estimated Value: $1,591,000 - $2,116,000
--
Bed
--
Bath
3,524
Sq Ft
$521/Sq Ft
Est. Value
About This Home
This home is located at 59 Sherwood Ave, Englewood Cliffs, NJ 07632 and is currently estimated at $1,836,679, approximately $521 per square foot. 59 Sherwood Ave is a home located in Bergen County with nearby schools including North Cliff Elementary School, Upper School Elementary School, and Dwight-Englewood School.
Ownership History
Date
Name
Owned For
Owner Type
Purchase Details
Closed on
Jul 10, 1997
Sold by
V&R Developers Inc
Bought by
Koppolu Sundar R D and Moses Robin
Current Estimated Value
Home Financials for this Owner
Home Financials are based on the most recent Mortgage that was taken out on this home.
Original Mortgage
$542,000
Outstanding Balance
$79,050
Interest Rate
7.7%
Estimated Equity
$1,757,629
Purchase Details
Closed on
May 24, 1996
Sold by
Ma No 1 Llc
Bought by
V&R Developers
Create a Home Valuation Report for This Property
The Home Valuation Report is an in-depth analysis detailing your home's value as well as a comparison with similar homes in the area
Home Values in the Area
Average Home Value in this Area
Purchase History
| Date | Buyer | Sale Price | Title Company |
|---|---|---|---|
| Koppolu Sundar R D | $775,000 | -- | |
| V&R Developers | $190,000 | -- |
Source: Public Records
Mortgage History
| Date | Status | Borrower | Loan Amount |
|---|---|---|---|
| Open | Koppolu Sundar R D | $542,000 |
Source: Public Records
Tax History Compared to Growth
Tax History
| Year | Tax Paid | Tax Assessment Tax Assessment Total Assessment is a certain percentage of the fair market value that is determined by local assessors to be the total taxable value of land and additions on the property. | Land | Improvement |
|---|---|---|---|---|
| 2025 | $15,854 | $1,372,600 | $655,500 | $717,100 |
| 2024 | $15,661 | $1,372,600 | $655,500 | $717,100 |
| 2023 | $15,414 | $1,372,600 | $655,500 | $717,100 |
| 2022 | $15,414 | $1,372,600 | $655,500 | $717,100 |
| 2021 | $15,428 | $1,372,600 | $655,500 | $717,100 |
| 2020 | $15,799 | $1,372,600 | $655,500 | $717,100 |
| 2019 | $14,838 | $1,372,600 | $655,500 | $717,100 |
| 2018 | $14,316 | $1,372,600 | $655,500 | $717,100 |
| 2017 | $13,699 | $1,372,600 | $655,500 | $717,100 |
| 2016 | $13,438 | $1,372,600 | $655,500 | $717,100 |
| 2015 | $12,765 | $1,372,600 | $655,500 | $717,100 |
| 2014 | $11,942 | $1,372,600 | $655,500 | $717,100 |
Source: Public Records
Map
Nearby Homes