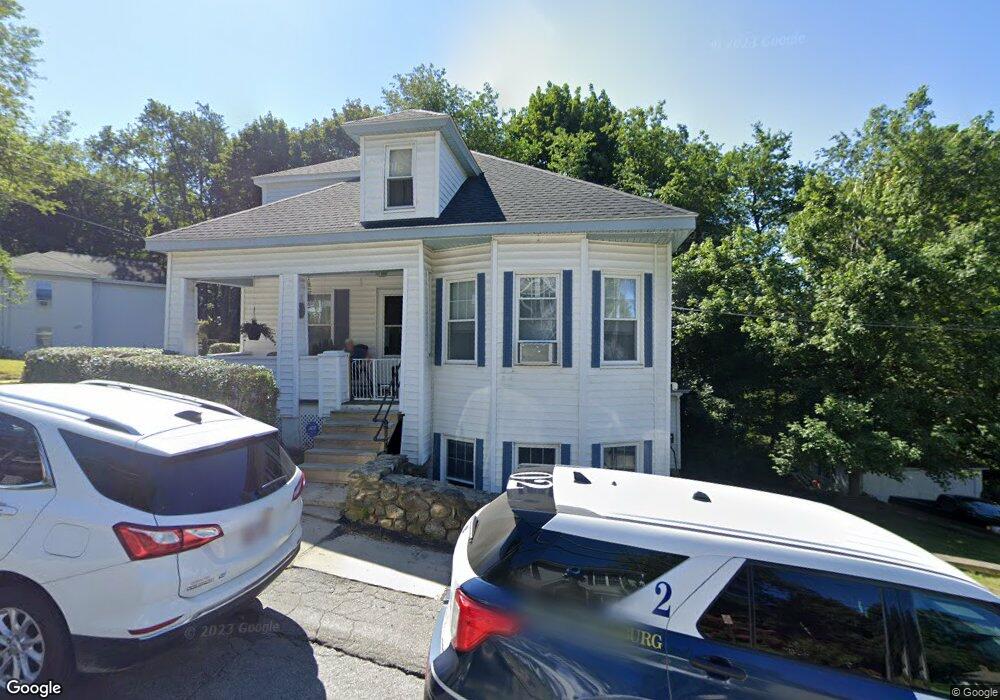
59 Simonds St Fitchburg, MA 01420
North of Main NeighborhoodEstimated Value: $449,000 - $501,000
6
Beds
3
Baths
2,862
Sq Ft
$164/Sq Ft
Est. Value
About This Home
This home is located at 59 Simonds St, Fitchburg, MA 01420 and is currently estimated at $469,209, approximately $163 per square foot. 59 Simonds St is a home located in Worcester County with nearby schools including Crocker Elementary School, South Street Elementary School, and Fitchburg High School.
Ownership History
Date
Name
Owned For
Owner Type
Purchase Details
Closed on
Mar 27, 2025
Sold by
Friend Terry A
Bought by
Friend Timothy J
Current Estimated Value
Purchase Details
Closed on
Oct 23, 2024
Sold by
59 Simonds St Rt and Friend
Bought by
Friend Terry A
Purchase Details
Closed on
Jan 21, 2020
Sold by
Friend Terry A and Friend Patricia A
Bought by
59 Simonds Street Rt and Friend
Purchase Details
Closed on
Feb 20, 1976
Bought by
Friend Terry A and Friend Patricia A
Create a Home Valuation Report for This Property
The Home Valuation Report is an in-depth analysis detailing your home's value as well as a comparison with similar homes in the area
Home Values in the Area
Average Home Value in this Area
Purchase History
| Date | Buyer | Sale Price | Title Company |
|---|---|---|---|
| Friend Timothy J | -- | None Available | |
| Friend Timothy J | -- | None Available | |
| Friend Terry A | -- | None Available | |
| Friend Terry A | -- | None Available | |
| Friend Terry A | -- | None Available | |
| 59 Simonds Street Rt | -- | None Available | |
| Friend Terry A | $18,500 | -- |
Source: Public Records
Mortgage History
| Date | Status | Borrower | Loan Amount |
|---|---|---|---|
| Previous Owner | Friend Terry A | $60,000 | |
| Previous Owner | Friend Terry A | $56,000 | |
| Previous Owner | Friend Terry A | $36,000 |
Source: Public Records
Tax History Compared to Growth
Tax History
| Year | Tax Paid | Tax Assessment Tax Assessment Total Assessment is a certain percentage of the fair market value that is determined by local assessors to be the total taxable value of land and additions on the property. | Land | Improvement |
|---|---|---|---|---|
| 2025 | $5,328 | $394,400 | $86,600 | $307,800 |
| 2024 | $4,942 | $333,700 | $52,100 | $281,600 |
| 2023 | $4,723 | $294,800 | $40,000 | $254,800 |
| 2022 | $4,248 | $241,200 | $35,100 | $206,100 |
| 2021 | $3,943 | $207,200 | $26,700 | $180,500 |
| 2020 | $3,656 | $185,500 | $21,800 | $163,700 |
| 2019 | $3,381 | $165,000 | $30,300 | $134,700 |
| 2018 | $3,177 | $151,200 | $27,900 | $123,300 |
| 2017 | $2,845 | $132,400 | $25,400 | $107,000 |
| 2016 | $2,811 | $132,400 | $25,400 | $107,000 |
| 2015 | $2,690 | $130,100 | $26,700 | $103,400 |
| 2014 | $2,580 | $130,100 | $26,700 | $103,400 |
Source: Public Records
Map
Nearby Homes