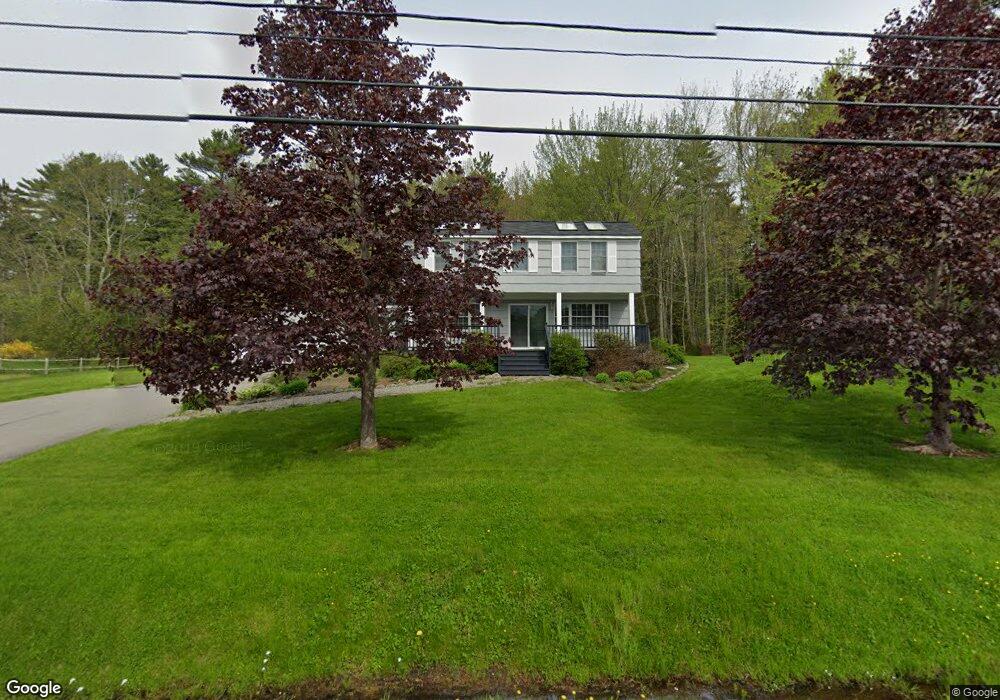
59 Simonton Rd Camden, ME 04843
Estimated Value: $425,000 - $586,000
3
Beds
2
Baths
1,419
Sq Ft
$357/Sq Ft
Est. Value
About This Home
This home is located at 59 Simonton Rd, Camden, ME 04843 and is currently estimated at $506,062, approximately $356 per square foot. 59 Simonton Rd is a home located in Knox County with nearby schools including Camden-Rockport Elementary School, Camden-Rockport Middle School, and Camden Hills Regional High School.
Ownership History
Date
Name
Owned For
Owner Type
Purchase Details
Closed on
Apr 2, 2008
Sold by
Moody Diane L
Bought by
Rafter John W and Rafter Michele
Current Estimated Value
Home Financials for this Owner
Home Financials are based on the most recent Mortgage that was taken out on this home.
Original Mortgage
$142,250
Outstanding Balance
$90,532
Interest Rate
6.06%
Mortgage Type
Purchase Money Mortgage
Estimated Equity
$415,530
Create a Home Valuation Report for This Property
The Home Valuation Report is an in-depth analysis detailing your home's value as well as a comparison with similar homes in the area
Home Values in the Area
Average Home Value in this Area
Purchase History
| Date | Buyer | Sale Price | Title Company |
|---|---|---|---|
| Rafter John W | -- | -- |
Source: Public Records
Mortgage History
| Date | Status | Borrower | Loan Amount |
|---|---|---|---|
| Open | Rafter John W | $142,250 |
Source: Public Records
Tax History Compared to Growth
Tax History
| Year | Tax Paid | Tax Assessment Tax Assessment Total Assessment is a certain percentage of the fair market value that is determined by local assessors to be the total taxable value of land and additions on the property. | Land | Improvement |
|---|---|---|---|---|
| 2024 | $4,959 | $472,300 | $159,000 | $313,300 |
| 2023 | $4,521 | $327,600 | $64,000 | $263,600 |
| 2022 | $4,324 | $327,600 | $64,000 | $263,600 |
| 2021 | $3,699 | $241,000 | $68,500 | $172,500 |
| 2020 | $3,622 | $241,000 | $68,500 | $172,500 |
| 2019 | $3,593 | $241,000 | $68,500 | $172,500 |
| 2018 | $3,403 | $228,700 | $64,900 | $163,800 |
| 2017 | $3,289 | $228,700 | $64,900 | $163,800 |
| 2016 | $3,576 | $229,400 | $63,200 | $166,200 |
| 2015 | $3,471 | $229,400 | $63,200 | $166,200 |
| 2014 | $3,257 | $225,700 | $63,200 | $162,500 |
| 2013 | $3,169 | $225,700 | $63,200 | $162,500 |
Source: Public Records
Map
Nearby Homes