59 State St Westerly, RI 02891
Estimated Value: $508,000 - $526,000
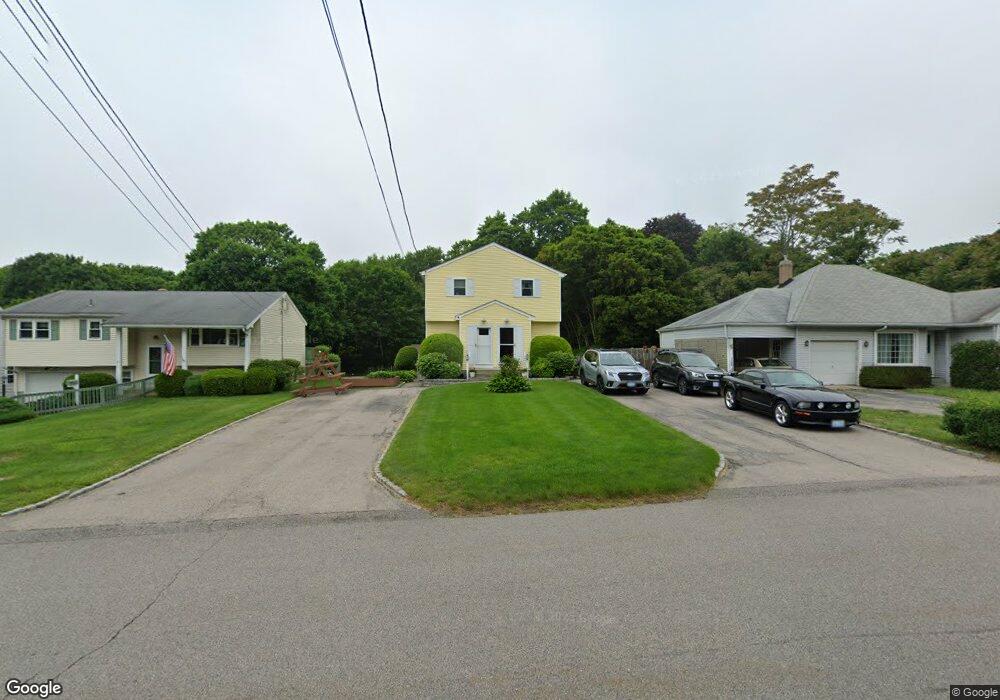
About This Home
This home is located at 59 State St, Westerly, RI 02891 and is currently estimated at $520,706, approximately $289 per square foot. 59 State St is a home located in Washington County with nearby schools including Westerly High School and St. Michael School.
Ownership History
We collect this data history from publicly available records. To have your information removed, we recommend requesting removal directly through your county’s website.
Purchase Details
Home Values in the Area
Average Home Value in this Area
Purchase History
We collect this data history from publicly available records. To have your information removed, we recommend requesting removal directly through your county’s website.
| Date | Buyer | Sale Price | Title Company |
|---|---|---|---|
| $120,000 | -- |
Tax History
We collect this data history from publicly available records. To have your information removed, we recommend requesting removal directly through your county’s website.
| Year | Tax Paid | Tax Assessment Tax Assessment Total Assessment is a certain percentage of the fair market value that is determined by local assessors to be the total taxable value of land and additions on the property. | Land | Improvement |
|---|---|---|---|---|
| 2025 | $3,210 | $412,600 | $160,700 | $251,900 |
| 2024 | $2,954 | $282,700 | $115,200 | $167,500 |
| 2023 | $2,872 | $282,700 | $115,200 | $167,500 |
| 2022 | $2,834 | $282,700 | $115,200 | $167,500 |
| 2021 | $2,834 | $235,000 | $100,300 | $134,700 |
| 2020 | $2,785 | $235,000 | $100,300 | $134,700 |
| 2019 | $2,759 | $235,000 | $100,300 | $134,700 |
| 2018 | $2,728 | $220,900 | $100,300 | $120,600 |
| 2017 | $2,651 | $220,900 | $100,300 | $120,600 |
| 2016 | $2,651 | $220,900 | $100,300 | $120,600 |
| 2015 | $2,511 | $223,600 | $107,200 | $116,400 |
| 2014 | $2,471 | $223,600 | $107,200 | $116,400 |
Map
- 68 Beach St
- 24 Abbey Ln Unit 13
- 16 Abbey Ln Unit 17
- 10 Hobart St
- 25 Meadow Lark Dr
- 82 Wells St
- 38 Chester Ave
- 8 Longvue Ave
- 34 Lanphere Rd
- 114 Granite St Unit 220
- 114 Granite St Unit 310
- 2 Elm St
- 21 Chase St
- 26 Field St
- 97 River Rd
- 36 Ledward Ave
- 39 Buckingham St
- 51 Lathrop Ave
- 174 River Rd
- 28 River Crest Dr
Ask me questions while you tour the home.