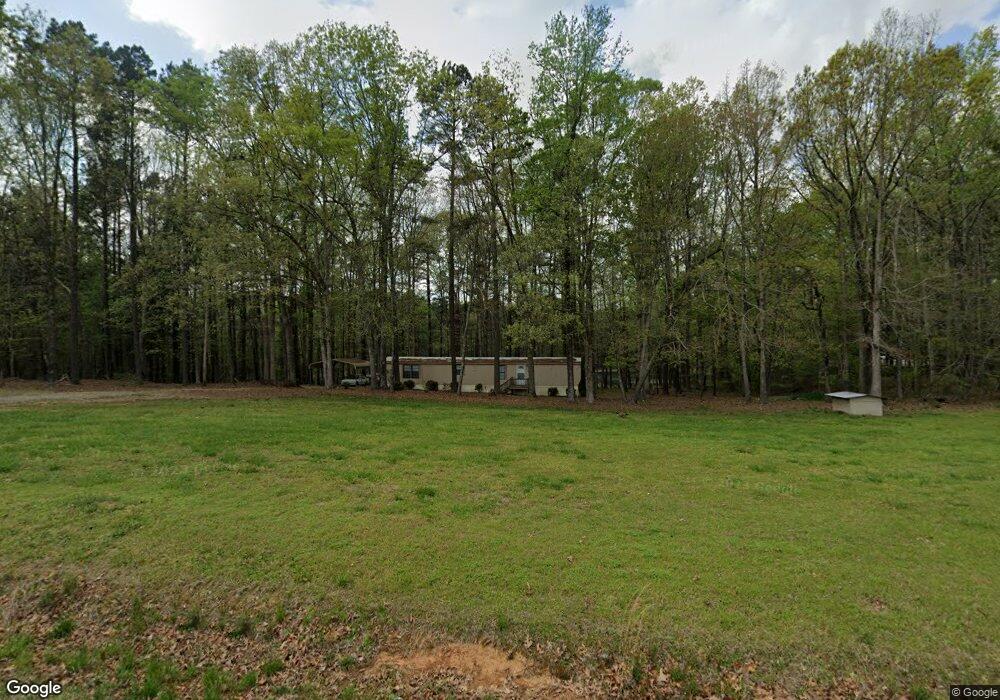
59 Suitt Rd Franklinton, NC 27525
Estimated Value: $274,000 - $350,632
2
Beds
3
Baths
1,816
Sq Ft
$166/Sq Ft
Est. Value
About This Home
This home is located at 59 Suitt Rd, Franklinton, NC 27525 and is currently estimated at $301,908, approximately $166 per square foot. 59 Suitt Rd is a home located in Franklin County with nearby schools including Franklinton Elementary School, Franklinton Middle School, and Franklinton High School.
Ownership History
Date
Name
Owned For
Owner Type
Purchase Details
Closed on
Jul 10, 2019
Sold by
Jorval Properties Inc
Bought by
Moore Thomas Richard Andrews
Current Estimated Value
Home Financials for this Owner
Home Financials are based on the most recent Mortgage that was taken out on this home.
Original Mortgage
$181,818
Outstanding Balance
$159,289
Interest Rate
3.82%
Mortgage Type
New Conventional
Estimated Equity
$142,619
Purchase Details
Closed on
Jan 25, 2019
Sold by
Tipiana Jorge and Tipiana Jorge
Bought by
Jorval Properties Inc
Purchase Details
Closed on
Oct 17, 2018
Sold by
Fannie Mae
Bought by
Tipiani Jorge
Purchase Details
Closed on
May 31, 2018
Sold by
Hudson Otis D and Hudson Janie F
Bought by
Federal National Mortgae Association
Purchase Details
Closed on
May 16, 2005
Sold by
Fernandez Jose Antonio and Fernandez Cynthia
Bought by
Hudson Otis Donald
Create a Home Valuation Report for This Property
The Home Valuation Report is an in-depth analysis detailing your home's value as well as a comparison with similar homes in the area
Home Values in the Area
Average Home Value in this Area
Purchase History
| Date | Buyer | Sale Price | Title Company |
|---|---|---|---|
| Moore Thomas Richard Andrews | $180,000 | None Available | |
| Jorval Properties Inc | -- | None Available | |
| Tipiani Jorge | -- | None Available | |
| Federal National Mortgae Association | -- | None Available | |
| Hudson Otis Donald | -- | None Available |
Source: Public Records
Mortgage History
| Date | Status | Borrower | Loan Amount |
|---|---|---|---|
| Open | Moore Thomas Richard Andrews | $181,818 |
Source: Public Records
Tax History Compared to Growth
Tax History
| Year | Tax Paid | Tax Assessment Tax Assessment Total Assessment is a certain percentage of the fair market value that is determined by local assessors to be the total taxable value of land and additions on the property. | Land | Improvement |
|---|---|---|---|---|
| 2024 | $4,200 | $315,800 | $71,490 | $244,310 |
| 2023 | $2,849 | $169,600 | $14,740 | $154,860 |
| 2022 | $2,822 | $169,600 | $14,740 | $154,860 |
| 2021 | $2,771 | $169,600 | $14,740 | $154,860 |
| 2020 | $2,775 | $169,600 | $14,740 | $154,860 |
| 2019 | $2,769 | $169,600 | $14,740 | $154,860 |
| 2018 | $1,266 | $74,750 | $14,740 | $60,010 |
| 2017 | $1,015 | $55,790 | $14,740 | $41,050 |
| 2016 | $1,033 | $55,790 | $14,740 | $41,050 |
| 2015 | $1,028 | $55,790 | $14,740 | $41,050 |
| 2014 | $974 | $55,790 | $14,740 | $41,050 |
Source: Public Records
Map
Nearby Homes
- 10 Hermitage Ln
- 15 Cole Creek Way
- 60 Cole Creek Way
- 0 Gordon Moore Rd
- 95 Cullen Ct
- 4073 Pine Ridge Rd
- 4330 Medicus Ln
- 175 Purslane Dr
- 145 Vast View Way
- 155 Vast View Way
- 140 Purslane Dr
- 150 Vast View Way
- 110 Vast View Way
- 35 Pebble Creek Dr
- 325 Olde Liberty Dr
- 50 Pebble Creek Dr
- 65 Purslane Dr
- 95 Purslane Dr
- 60 Purslane Dr
- 345 Sutherland Dr
- 62 Suitt Rd
- 74 Suitt Rd
- 48 Suitt Rd
- Lot 4 Suitt Rd
- 86 Suitt Rd
- 42 Suitt Rd
- 30 Suitt Rd
- 119 Suitt Rd
- 108 Suitt Rd
- 1390 Gordon Moore Rd
- Lot 1 Gordon Moore Rd
- 4 Suitt Rd
- 1388 Gordon Moore Rd
- 20 Hermitage Ln
- 143 Suitt Rd
- 10 Steeplechase Run
- 133 Suitt Rd
- 1421 Gordon Moore Rd
- 0 Steeplechase Run
- 40 Hermitage Ln