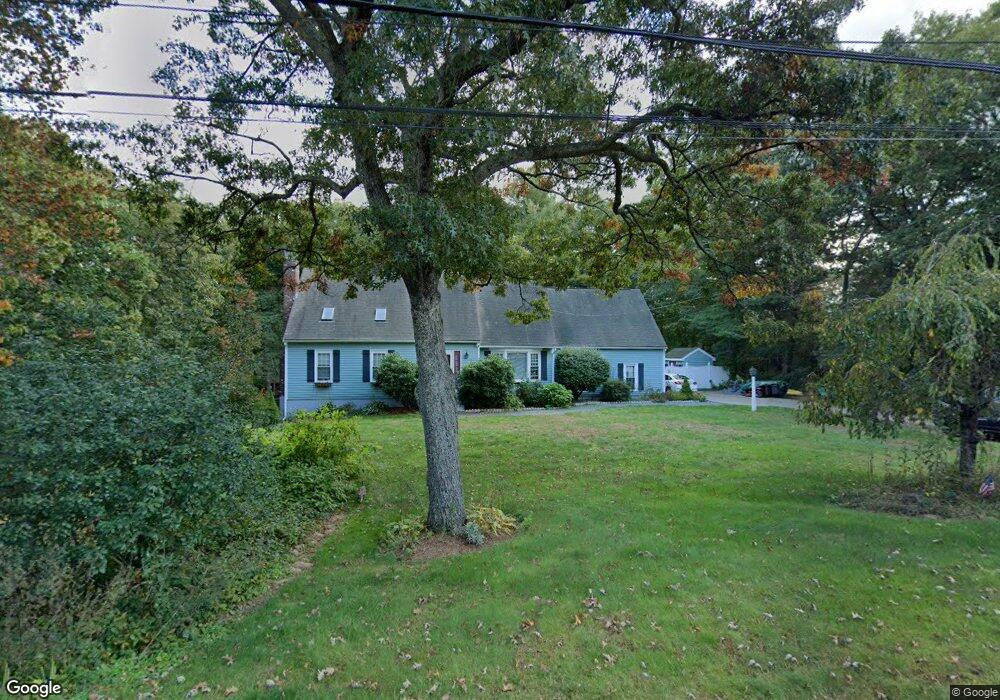
59 Summer St Foxboro, MA 02035
Estimated Value: $754,000 - $896,945
3
Beds
3
Baths
1,752
Sq Ft
$483/Sq Ft
Est. Value
About This Home
This home is located at 59 Summer St, Foxboro, MA 02035 and is currently estimated at $846,736, approximately $483 per square foot. 59 Summer St is a home located in Norfolk County with nearby schools including Foxborough High School, St Mary's Catholic School, and Hands-On-Montessori School.
Ownership History
Date
Name
Owned For
Owner Type
Purchase Details
Closed on
Dec 1, 1995
Sold by
Cederholm Eric J and Cederholm Danielle S
Bought by
Martin Allen S and Martin Nancy E
Current Estimated Value
Home Financials for this Owner
Home Financials are based on the most recent Mortgage that was taken out on this home.
Original Mortgage
$150,000
Outstanding Balance
$3,069
Interest Rate
7.37%
Mortgage Type
Purchase Money Mortgage
Estimated Equity
$843,667
Create a Home Valuation Report for This Property
The Home Valuation Report is an in-depth analysis detailing your home's value as well as a comparison with similar homes in the area
Home Values in the Area
Average Home Value in this Area
Purchase History
| Date | Buyer | Sale Price | Title Company |
|---|---|---|---|
| Martin Allen S | $207,000 | -- |
Source: Public Records
Mortgage History
| Date | Status | Borrower | Loan Amount |
|---|---|---|---|
| Open | Martin Allen S | $25,000 | |
| Open | Martin Allen S | $150,000 |
Source: Public Records
Tax History Compared to Growth
Tax History
| Year | Tax Paid | Tax Assessment Tax Assessment Total Assessment is a certain percentage of the fair market value that is determined by local assessors to be the total taxable value of land and additions on the property. | Land | Improvement |
|---|---|---|---|---|
| 2025 | $9,680 | $732,200 | $269,200 | $463,000 |
| 2024 | $8,691 | $643,300 | $268,500 | $374,800 |
| 2023 | $8,492 | $597,600 | $256,100 | $341,500 |
| 2022 | $8,361 | $575,800 | $245,400 | $330,400 |
| 2021 | $7,603 | $515,800 | $223,700 | $292,100 |
| 2020 | $7,355 | $504,800 | $223,700 | $281,100 |
| 2019 | $7,006 | $476,600 | $213,300 | $263,300 |
| 2018 | $6,880 | $472,200 | $213,300 | $258,900 |
| 2017 | $6,497 | $432,000 | $199,700 | $232,300 |
| 2016 | $6,499 | $438,500 | $192,600 | $245,900 |
| 2015 | $6,220 | $409,500 | $163,600 | $245,900 |
| 2014 | $5,995 | $399,900 | $160,500 | $239,400 |
Source: Public Records
Map
Nearby Homes
- 5 Lauren Ln
- 67 Morse St
- 7 Revere Dr
- 261 East St
- 12 Community Way
- 9 Independence Dr Unit 9
- 35 Independence Dr Unit 35
- 132 Cannon Forge Dr
- 25 Winter St
- 619 N Main St
- 170 Cannon Forge Dr
- 55-57 Pine Needle Ln
- 44 Angell St Unit 44
- 60 King St
- 28 Angell St
- 3 Cushing Ln
- 409 Pratt St
- 82 Brook St
- 2 Red Fox Run
- 99 Pleasant St