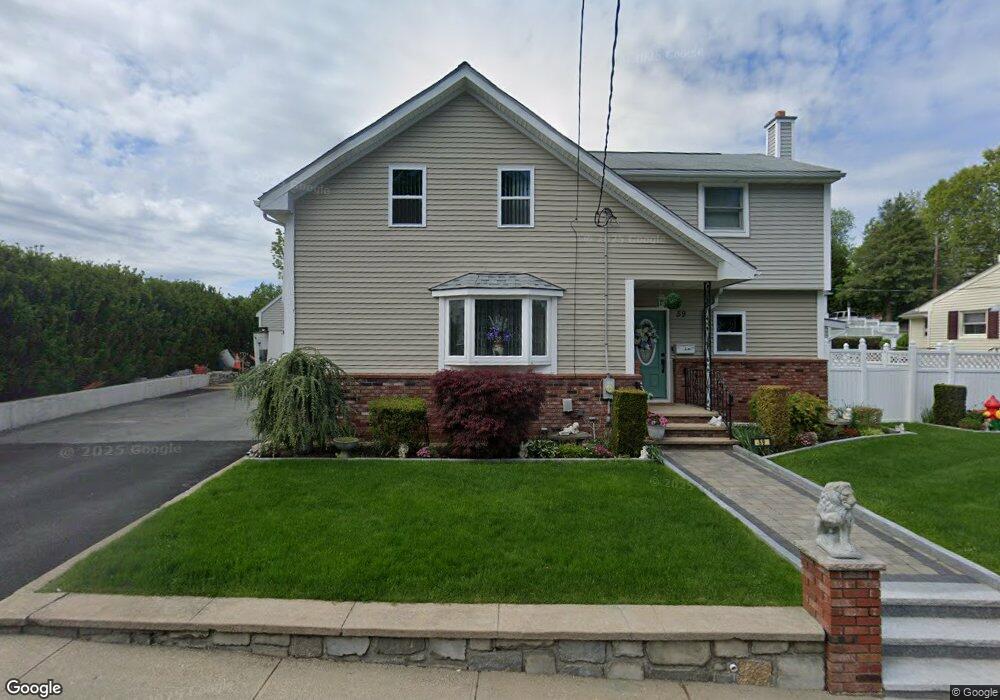
59 Summit Ave West Warwick, RI 02893
Lippitt-Harris NeighborhoodEstimated Value: $467,000 - $804,703
Studio
--
Bath
--
Sq Ft
8,189
Sq Ft Lot Lot
About This Home
This home is located at 59 Summit Ave, West Warwick, RI 02893 and is currently estimated at $642,676. 59 Summit Ave is a home located in Kent County with nearby schools including West Warwick High School, St Joseph School, and Islamic School of Rhode Island.
Ownership History
Date
Name
Owned For
Owner Type
Purchase Details
Closed on
Oct 28, 2024
Sold by
Silva Joao and Silva Rosalina M
Bought by
Summit Avenue Irt and Carreiro
Current Estimated Value
Purchase Details
Closed on
Oct 25, 2013
Sold by
Silva John C
Bought by
Silva Joao A and Silva Rosalina M
Home Financials for this Owner
Home Financials are based on the most recent Mortgage that was taken out on this home.
Original Mortgage
$115,000
Interest Rate
4.56%
Mortgage Type
New Conventional
Create a Home Valuation Report for This Property
The Home Valuation Report is an in-depth analysis detailing your home's value as well as a comparison with similar homes in the area
Home Values in the Area
Average Home Value in this Area
Purchase History
We collect this data history from publicly available records. To have your information removed, we recommend requesting removal directly through your county’s website.
| Date | Buyer | Sale Price | Title Company |
|---|---|---|---|
| Summit Avenue Irt | -- | None Available | |
| Summit Avenue Irt | -- | None Available | |
| Silva Joao A | -- | -- | |
| Silva Joao A | -- | -- |
Source: Public Records
Mortgage History
We collect this data history from publicly available records. To have your information removed, we recommend requesting removal directly through your county’s website.
| Date | Status | Borrower | Loan Amount |
|---|---|---|---|
| Previous Owner | Silva Joao A | $100,000 | |
| Previous Owner | Silva Joao A | $115,000 | |
| Previous Owner | Silva Joao A | $132,000 |
Source: Public Records
Tax History
| Year | Tax Paid | Tax Assessment Tax Assessment Total Assessment is a certain percentage of the fair market value that is determined by local assessors to be the total taxable value of land and additions on the property. | Land | Improvement |
|---|---|---|---|---|
| 2025 | $8,991 | $629,200 | $86,500 | $542,700 |
| 2024 | $8,796 | $470,600 | $70,700 | $399,900 |
| 2023 | $8,621 | $470,600 | $70,700 | $399,900 |
| 2022 | $8,490 | $470,600 | $70,700 | $399,900 |
| 2021 | $8,229 | $357,800 | $59,400 | $298,400 |
| 2020 | $8,229 | $357,800 | $59,400 | $298,400 |
| 2019 | $10,491 | $357,800 | $59,400 | $298,400 |
| 2018 | $8,138 | $299,400 | $56,900 | $242,500 |
| 2017 | $7,877 | $299,400 | $56,900 | $242,500 |
| 2016 | $7,736 | $299,400 | $56,900 | $242,500 |
| 2015 | $7,907 | $304,600 | $56,900 | $247,700 |
| 2014 | $1,933 | $304,600 | $56,900 | $247,700 |
Source: Public Records
Map
Nearby Homes
Your Personal Tour Guide
Ask me questions while you tour the home.