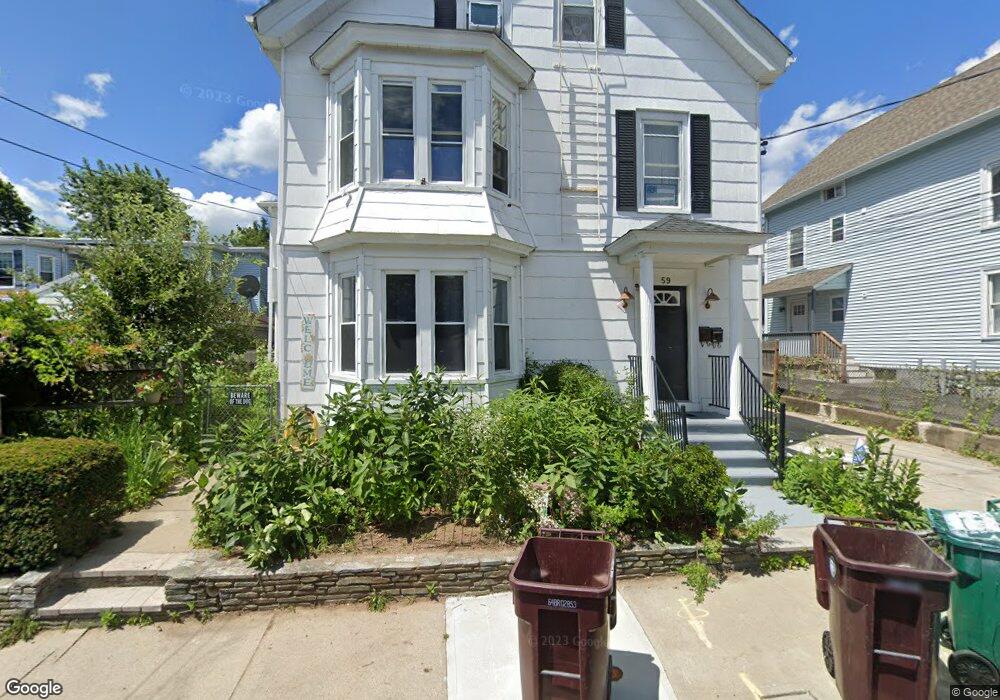
59 Summit St Woonsocket, RI 02895
Globe District NeighborhoodEstimated Value: $402,819 - $512,000
5
Beds
2
Baths
2,170
Sq Ft
$217/Sq Ft
Est. Value
About This Home
This home is located at 59 Summit St, Woonsocket, RI 02895 and is currently estimated at $469,955, approximately $216 per square foot. 59 Summit St is a home located in Providence County with nearby schools including Woonsocket High School, Founders Academy, and Beacon Charter School.
Ownership History
Date
Name
Owned For
Owner Type
Purchase Details
Closed on
Apr 6, 2021
Sold by
Sutherland James A and Sutherland Patsy J
Bought by
Sutherland Ft and Sutherland
Current Estimated Value
Purchase Details
Closed on
Mar 1, 1994
Sold by
Pichette Kenneth G and Pichette Jane
Bought by
Sutherland James A and Sutherland Patsy
Home Financials for this Owner
Home Financials are based on the most recent Mortgage that was taken out on this home.
Original Mortgage
$110,160
Interest Rate
6.96%
Mortgage Type
Purchase Money Mortgage
Create a Home Valuation Report for This Property
The Home Valuation Report is an in-depth analysis detailing your home's value as well as a comparison with similar homes in the area
Home Values in the Area
Average Home Value in this Area
Purchase History
| Date | Buyer | Sale Price | Title Company |
|---|---|---|---|
| Sutherland Ft | -- | None Available | |
| Sutherland Ft | -- | None Available | |
| Sutherland Ft | -- | None Available | |
| Sutherland James A | $108,000 | -- | |
| Sutherland James A | $108,000 | -- |
Source: Public Records
Mortgage History
| Date | Status | Borrower | Loan Amount |
|---|---|---|---|
| Previous Owner | Sutherland James A | $109,450 | |
| Previous Owner | Sutherland James A | $30,000 | |
| Previous Owner | Sutherland James A | $107,400 | |
| Previous Owner | Sutherland James A | $110,160 |
Source: Public Records
Tax History
| Year | Tax Paid | Tax Assessment Tax Assessment Total Assessment is a certain percentage of the fair market value that is determined by local assessors to be the total taxable value of land and additions on the property. | Land | Improvement |
|---|---|---|---|---|
| 2025 | $4,258 | $379,200 | $104,200 | $275,000 |
| 2024 | $3,796 | $261,100 | $92,500 | $168,600 |
| 2023 | $3,650 | $261,100 | $92,500 | $168,600 |
| 2022 | $3,650 | $261,100 | $92,500 | $168,600 |
| 2021 | $3,612 | $152,100 | $56,300 | $95,800 |
| 2020 | $3,650 | $152,100 | $56,300 | $95,800 |
| 2018 | $3,663 | $152,100 | $56,300 | $95,800 |
| 2017 | $3,675 | $122,100 | $45,400 | $76,700 |
| 2016 | $3,888 | $122,100 | $45,400 | $76,700 |
| 2015 | $4,466 | $122,100 | $45,400 | $76,700 |
| 2014 | $4,131 | $126,300 | $50,000 | $76,300 |
Source: Public Records
Map
Nearby Homes
- 80 Summit St
- 43 Summit St
- 190 Coe St
- 184 Avenue C Unit 2
- 184 Avenue C Unit 5
- 184 Avenue C Unit 6
- 184 Avenue C Unit 3
- 184 Avenue C Unit 4
- 184 Avenue C Unit 1
- 435 S Main St
- 84 Bernice Ave
- 0 Holbrook Ln Unit 1402850
- 604 Providence St
- 92 Rockland Ave
- 1 Admiral St
- 122 Grand St
- 1060 Park Ave
- 34 Smithfield Rd
- 83 4th Ave
- 25 Ormond St
Your Personal Tour Guide
Ask me questions while you tour the home.