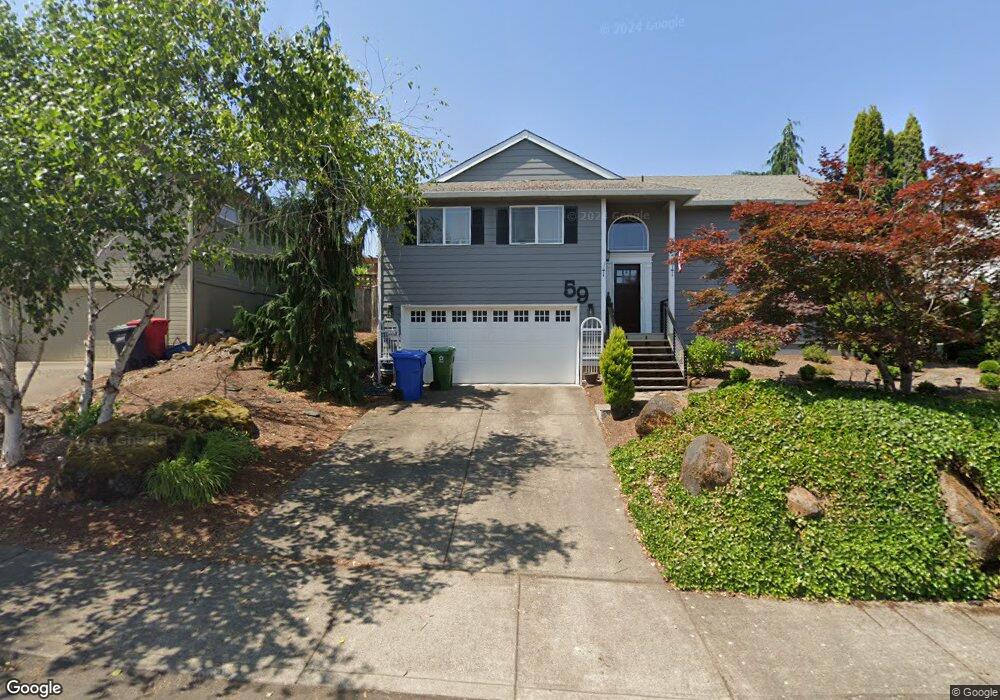
59 Sweden Cir Silverton, OR 97381
Estimated Value: $589,894 - $669,000
3
Beds
3
Baths
2,071
Sq Ft
$303/Sq Ft
Est. Value
About This Home
This home is located at 59 Sweden Cir, Silverton, OR 97381 and is currently estimated at $626,724, approximately $302 per square foot. 59 Sweden Cir is a home located in Marion County with nearby schools including Mark Twain Elementary School, Silverton Middle School, and Silverton High School.
Ownership History
Date
Name
Owned For
Owner Type
Purchase Details
Closed on
Dec 17, 2010
Sold by
Cleary Tyler A and Cleary Julie S
Bought by
Dillon Sean James and Dillon Molly Gembala
Current Estimated Value
Home Financials for this Owner
Home Financials are based on the most recent Mortgage that was taken out on this home.
Original Mortgage
$140,000
Outstanding Balance
$92,448
Interest Rate
4.21%
Mortgage Type
New Conventional
Estimated Equity
$534,276
Purchase Details
Closed on
Aug 21, 2002
Sold by
Cleary Tyler A
Bought by
Cleary Tyler A and Cleary Julie S
Home Financials for this Owner
Home Financials are based on the most recent Mortgage that was taken out on this home.
Original Mortgage
$120,000
Interest Rate
6.52%
Mortgage Type
Purchase Money Mortgage
Purchase Details
Closed on
Dec 21, 2001
Sold by
Hames George W
Bought by
Bankone National Assn and The First National Bank Of Chicago
Create a Home Valuation Report for This Property
The Home Valuation Report is an in-depth analysis detailing your home's value as well as a comparison with similar homes in the area
Home Values in the Area
Average Home Value in this Area
Purchase History
| Date | Buyer | Sale Price | Title Company |
|---|---|---|---|
| Dillon Sean James | $240,000 | Amerititle | |
| Cleary Tyler A | -- | First American | |
| Cleary Tyler A | $160,000 | First American | |
| Bankone National Assn | $151,598 | -- |
Source: Public Records
Mortgage History
| Date | Status | Borrower | Loan Amount |
|---|---|---|---|
| Open | Dillon Sean James | $140,000 | |
| Previous Owner | Cleary Tyler A | $120,000 |
Source: Public Records
Tax History Compared to Growth
Tax History
| Year | Tax Paid | Tax Assessment Tax Assessment Total Assessment is a certain percentage of the fair market value that is determined by local assessors to be the total taxable value of land and additions on the property. | Land | Improvement |
|---|---|---|---|---|
| 2024 | $4,203 | $253,620 | -- | -- |
| 2023 | $4,095 | $246,240 | $0 | $0 |
| 2022 | $3,877 | $239,070 | $0 | $0 |
| 2021 | $3,772 | $232,110 | $0 | $0 |
| 2020 | $3,679 | $225,350 | $0 | $0 |
| 2019 | $3,571 | $218,790 | $0 | $0 |
| 2018 | $3,585 | $0 | $0 | $0 |
| 2017 | $3,504 | $0 | $0 | $0 |
| 2016 | $3,441 | $0 | $0 | $0 |
| 2015 | $3,408 | $0 | $0 | $0 |
| 2014 | $3,304 | $0 | $0 | $0 |
Source: Public Records
Map
Nearby Homes