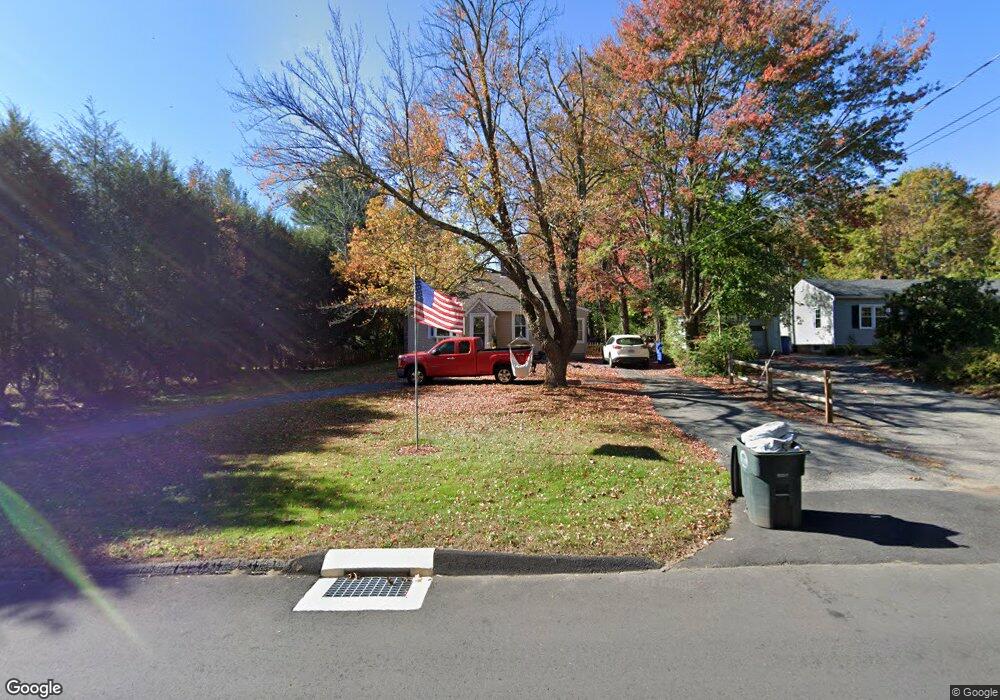
59 Torringford East St Torrington, CT 06790
Estimated Value: $275,000 - $302,000
3
Beds
1
Bath
1,045
Sq Ft
$277/Sq Ft
Est. Value
About This Home
This home is located at 59 Torringford East St, Torrington, CT 06790 and is currently estimated at $289,731, approximately $277 per square foot. 59 Torringford East St is a home located in Litchfield County with nearby schools including Torrington Middle School, Torrington High School, and Torrington Christian Academy.
Ownership History
Date
Name
Owned For
Owner Type
Purchase Details
Closed on
Jul 27, 2015
Sold by
Bieluch Jozef E and Bieluch Jessica L
Bought by
Mazzini Megan
Current Estimated Value
Home Financials for this Owner
Home Financials are based on the most recent Mortgage that was taken out on this home.
Original Mortgage
$113,660
Outstanding Balance
$89,332
Interest Rate
4.01%
Estimated Equity
$200,399
Purchase Details
Closed on
Nov 16, 2001
Sold by
Dickinson Christine N and Dickinson Scott A
Bought by
Bieluch Jozef E and Bieluch Jessica L
Purchase Details
Closed on
May 16, 2000
Sold by
Santamaria Gary P and Santamaria Anita L
Bought by
Dickinson Christine and Dickinson Scott
Purchase Details
Closed on
Jul 10, 1991
Sold by
Prahm David R
Bought by
Santo Gary and Santo Maria
Create a Home Valuation Report for This Property
The Home Valuation Report is an in-depth analysis detailing your home's value as well as a comparison with similar homes in the area
Home Values in the Area
Average Home Value in this Area
Purchase History
| Date | Buyer | Sale Price | Title Company |
|---|---|---|---|
| Mazzini Megan | $126,288 | -- | |
| Bieluch Jozef E | $118,000 | -- | |
| Dickinson Christine | $109,900 | -- | |
| Santo Gary | $115,000 | -- |
Source: Public Records
Mortgage History
| Date | Status | Borrower | Loan Amount |
|---|---|---|---|
| Open | Santo Gary | $113,660 | |
| Previous Owner | Santo Gary | $93,000 | |
| Previous Owner | Santo Gary | $115,000 |
Source: Public Records
Tax History Compared to Growth
Tax History
| Year | Tax Paid | Tax Assessment Tax Assessment Total Assessment is a certain percentage of the fair market value that is determined by local assessors to be the total taxable value of land and additions on the property. | Land | Improvement |
|---|---|---|---|---|
| 2025 | $5,528 | $143,780 | $21,630 | $122,150 |
| 2024 | $3,565 | $74,320 | $21,640 | $52,680 |
| 2023 | $3,564 | $74,320 | $21,640 | $52,680 |
| 2022 | $3,503 | $74,320 | $21,640 | $52,680 |
| 2021 | $3,431 | $74,320 | $21,640 | $52,680 |
| 2020 | $3,431 | $74,320 | $21,640 | $52,680 |
| 2019 | $3,196 | $69,220 | $21,630 | $47,590 |
| 2018 | $3,196 | $69,220 | $21,630 | $47,590 |
| 2017 | $3,167 | $69,220 | $21,630 | $47,590 |
| 2016 | $3,167 | $69,220 | $21,630 | $47,590 |
| 2015 | $3,099 | $67,740 | $21,630 | $46,110 |
| 2014 | $3,833 | $105,540 | $44,940 | $60,600 |
Source: Public Records
Map
Nearby Homes
- 73 Shirley Rd
- 51 Bradford Rd
- 111 Oxbow Dr
- 65 Oak Meadow Ln Unit 65
- 21 Oak Meadow Ln
- 325 Circle Dr
- 410 Circle Dr
- 69 Sunrise Dr
- 595 Torringford St
- 144 Morningside Dr
- 33 Dawn Ave
- 100 Nutmeg Dr
- 157 Edgewood Dr
- 178 Edgewood Dr
- 141 Highfield Dr
- 714 Torringford St
- 211 Lyman Dr
- 0 Torringford St W
- 29 Hannah Way
- 175 Ramstein Rd
- 49 Torringford East St
- 37 Torringford East St
- 69 Torringford East St
- 35 Shirley Rd
- 79 Torringford East St
- 49 Shirley Rd
- 25 Torringford East St
- 65 Shirley Rd
- 93 Torringford East St
- 84 Loretta Rd
- 60 Loretta Rd
- 11 Torringford East St
- 100 Loretta Rd
- 50 Loretta Rd
- 12 Shirley Rd
- 3 Torringford St E
- 70 Loretta Rd
- 171 Dutton Hill Rd
- 185 Dutton Hill Rd
- 32 Loretta Rd