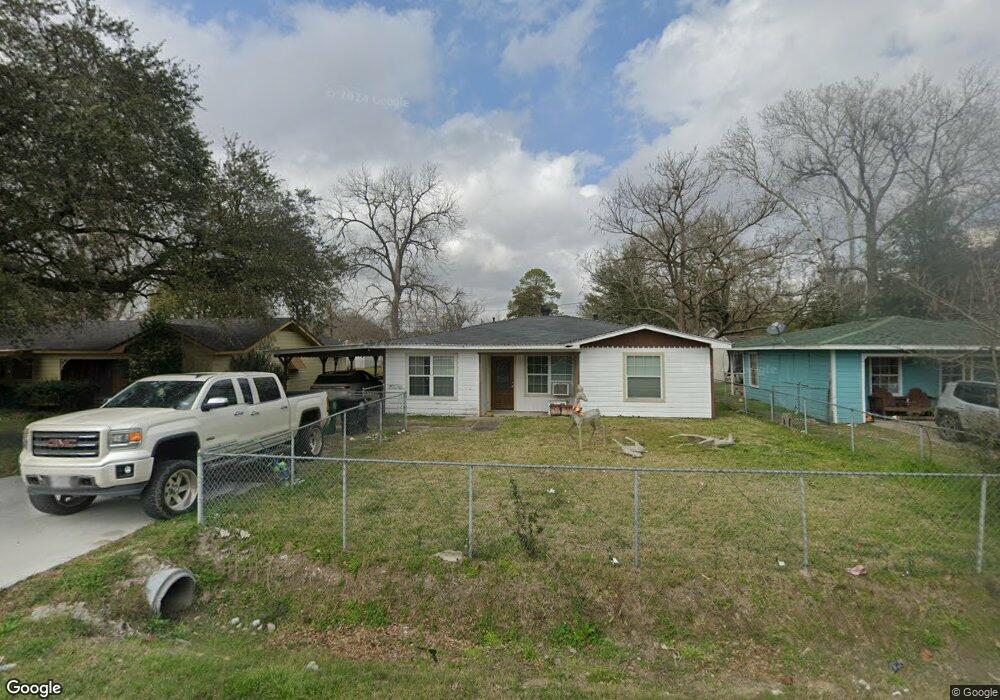
59 Turner Dr Houston, TX 77076
Northside-Northline NeighborhoodEstimated Value: $187,040 - $303,000
2
Beds
1
Bath
1,156
Sq Ft
$194/Sq Ft
Est. Value
About This Home
This home is located at 59 Turner Dr, Houston, TX 77076 and is currently estimated at $224,510, approximately $194 per square foot. 59 Turner Dr is a home located in Harris County with nearby schools including Lyons Elementary School, Fonville Middle School, and Sam Houston Math, Science & Technology Center.
Ownership History
Date
Name
Owned For
Owner Type
Purchase Details
Closed on
Mar 21, 2017
Sold by
Ferrell Robert D and Ferrell Robert David
Bought by
Serrano Roy Noel
Current Estimated Value
Home Financials for this Owner
Home Financials are based on the most recent Mortgage that was taken out on this home.
Original Mortgage
$62,938
Outstanding Balance
$54,006
Interest Rate
5.5%
Mortgage Type
FHA
Estimated Equity
$170,504
Create a Home Valuation Report for This Property
The Home Valuation Report is an in-depth analysis detailing your home's value as well as a comparison with similar homes in the area
Home Values in the Area
Average Home Value in this Area
Purchase History
| Date | Buyer | Sale Price | Title Company |
|---|---|---|---|
| Serrano Roy Noel | -- | Commonwealth Title Of Housto |
Source: Public Records
Mortgage History
| Date | Status | Borrower | Loan Amount |
|---|---|---|---|
| Open | Serrano Roy Noel | $62,938 |
Source: Public Records
Tax History Compared to Growth
Tax History
| Year | Tax Paid | Tax Assessment Tax Assessment Total Assessment is a certain percentage of the fair market value that is determined by local assessors to be the total taxable value of land and additions on the property. | Land | Improvement |
|---|---|---|---|---|
| 2025 | $1,686 | $195,812 | $111,321 | $84,491 |
| 2024 | $1,686 | $199,464 | $111,321 | $88,143 |
| 2023 | $1,686 | $200,363 | $107,730 | $92,633 |
| 2022 | $3,501 | $159,002 | $83,790 | $75,212 |
| 2021 | $2,668 | $114,457 | $43,890 | $70,567 |
| 2020 | $2,646 | $109,252 | $43,890 | $65,362 |
| 2019 | $2,738 | $108,190 | $43,890 | $64,300 |
| 2018 | $2,010 | $79,451 | $31,920 | $47,531 |
| 2017 | $2,009 | $79,451 | $31,920 | $47,531 |
| 2016 | $1,914 | $75,687 | $31,920 | $43,767 |
| 2015 | $1,886 | $73,383 | $31,920 | $41,463 |
| 2014 | $1,886 | $73,383 | $31,920 | $41,463 |
Source: Public Records
Map
Nearby Homes
- 10041 Fulton St
- 10135 Fulton St
- 10210 Fulton St
- 10202 Fulton St
- 10245 O Donnell Dr
- 9815 Fulton Park Ln
- 9905 Fulton St
- 9813 Fulton Park Ln
- 9910 Fulton St
- 64 Dipping Ln
- 9215 Plan at Fulton Crossing
- 9289 Plan at Fulton Crossing
- 9293 Plan at Fulton Crossing
- 9236 Plan at Fulton Crossing
- 46 Dipping Ln
- 58 Dipping Ln
- 40 Dipping Ln
- 904 Ellena Rd Unit 16
- 9816 Fulton St
- 59 E Sunnyside St