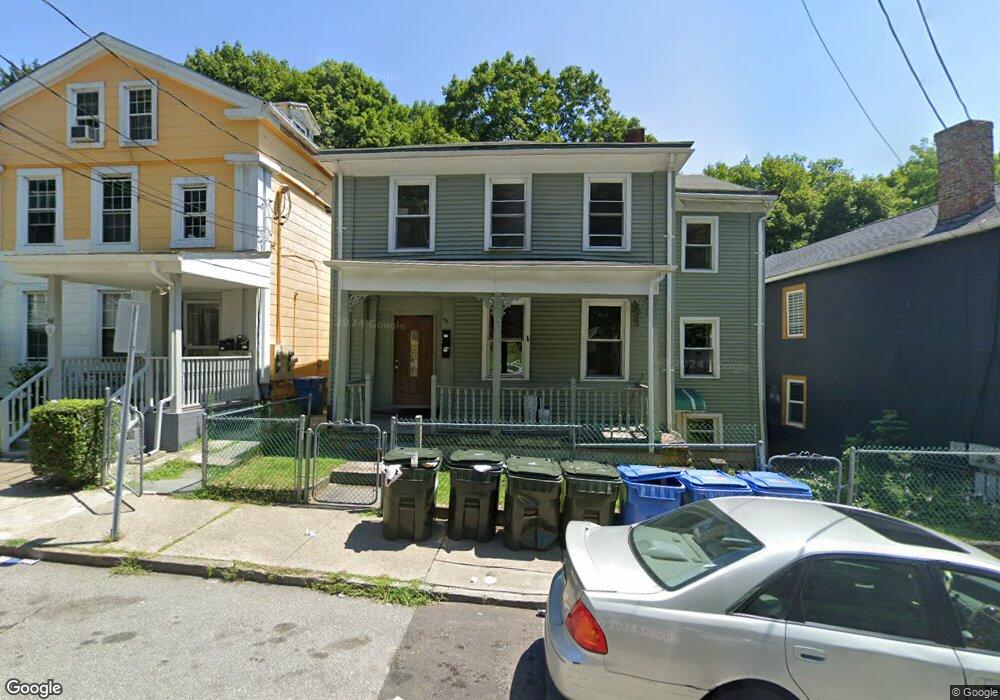
59 Union St Norwich, CT 06360
Central Norwich NeighborhoodEstimated Value: $168,000 - $245,000
4
Beds
2
Baths
1,996
Sq Ft
$106/Sq Ft
Est. Value
About This Home
This home is located at 59 Union St, Norwich, CT 06360 and is currently estimated at $212,419, approximately $106 per square foot. 59 Union St is a home located in New London County with nearby schools including Samuel Huntington Elementary School, Kelly STEAM Magnet Middle School, and Integrated Day Charter School.
Ownership History
Date
Name
Owned For
Owner Type
Purchase Details
Closed on
Sep 8, 2023
Sold by
Wadja Webster and Wadja Aedin
Bought by
Jubilee Construction Llc
Current Estimated Value
Home Financials for this Owner
Home Financials are based on the most recent Mortgage that was taken out on this home.
Original Mortgage
$177,500
Outstanding Balance
$173,628
Interest Rate
6.81%
Mortgage Type
Purchase Money Mortgage
Estimated Equity
$38,791
Purchase Details
Closed on
Jul 20, 2021
Sold by
Norwich City Of
Bought by
Wadja Webster and Wadaja Aedin
Purchase Details
Closed on
Nov 16, 2011
Sold by
Liang Xun Lin
Bought by
Leung Yiu Pui
Purchase Details
Closed on
Jan 13, 2004
Sold by
Peccini Wayne and Peccini Sharon
Bought by
Liang Xun Lin
Create a Home Valuation Report for This Property
The Home Valuation Report is an in-depth analysis detailing your home's value as well as a comparison with similar homes in the area
Home Values in the Area
Average Home Value in this Area
Purchase History
| Date | Buyer | Sale Price | Title Company |
|---|---|---|---|
| Jubilee Construction Llc | $125,000 | None Available | |
| Jubilee Construction Llc | $125,000 | None Available | |
| Wadja Webster | $62,000 | None Available | |
| Wadja Webster | $62,000 | None Available | |
| Leung Yiu Pui | -- | -- | |
| Leung Yiu Pui | -- | -- | |
| Liang Xun Lin | $69,900 | -- | |
| Liang Xun Lin | $69,900 | -- |
Source: Public Records
Mortgage History
| Date | Status | Borrower | Loan Amount |
|---|---|---|---|
| Open | Jubilee Construction Llc | $177,500 | |
| Closed | Jubilee Construction Llc | $177,500 |
Source: Public Records
Tax History Compared to Growth
Tax History
| Year | Tax Paid | Tax Assessment Tax Assessment Total Assessment is a certain percentage of the fair market value that is determined by local assessors to be the total taxable value of land and additions on the property. | Land | Improvement |
|---|---|---|---|---|
| 2025 | $4,253 | $105,100 | $21,900 | $83,200 |
| 2024 | $4,015 | $105,100 | $21,900 | $83,200 |
| 2023 | $3,711 | $76,300 | $15,400 | $60,900 |
| 2022 | $3,699 | $76,300 | $15,400 | $60,900 |
| 2021 | $3,711 | $76,300 | $15,400 | $60,900 |
| 2020 | $3,698 | $76,300 | $15,400 | $60,900 |
| 2019 | $3,662 | $76,300 | $15,400 | $60,900 |
| 2018 | $3,291 | $68,000 | $18,100 | $49,900 |
| 2017 | $3,314 | $68,000 | $18,100 | $49,900 |
| 2016 | $3,336 | $68,000 | $18,100 | $49,900 |
| 2015 | $3,268 | $68,000 | $18,100 | $49,900 |
| 2014 | $3,123 | $68,000 | $18,100 | $49,900 |
Source: Public Records
Map
Nearby Homes