59 Upland St Worcester, MA 01607
South Quinsigamond Village NeighborhoodEstimated Value: $374,174 - $458,000
3
Beds
1
Bath
1,256
Sq Ft
$318/Sq Ft
Est. Value
About This Home
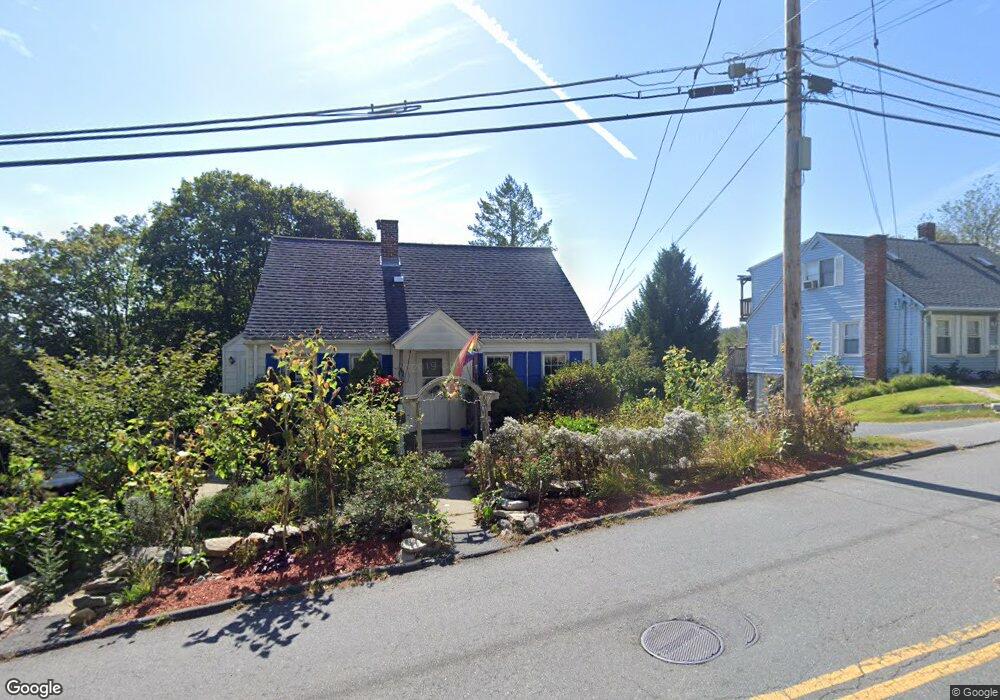
This home is located at 59 Upland St, Worcester, MA 01607 and is currently estimated at $399,544, approximately $318 per square foot. 59 Upland St is a home located in Worcester County with nearby schools including Quinsigamond School, Jacob Hiatt Magnet School, and Chandler Magnet.
Ownership History
Date
Name
Owned For
Owner Type
Purchase Details
Closed on
Jul 30, 1999
Sold by
Kaminski Joseph C and Kaminski Irene J
Bought by
Jung Allan
Current Estimated Value
Home Financials for this Owner
Home Financials are based on the most recent Mortgage that was taken out on this home.
Original Mortgage
$84,950
Interest Rate
7.61%
Mortgage Type
Purchase Money Mortgage
Create a Home Valuation Report for This Property
The Home Valuation Report is an in-depth analysis detailing your home's value as well as a comparison with similar homes in the area
Home Values in the Area
Average Home Value in this Area
Purchase History
| Date | Buyer | Sale Price | Title Company |
|---|---|---|---|
| Jung Allan | $87,600 | -- |
Source: Public Records
Mortgage History
| Date | Status | Borrower | Loan Amount |
|---|---|---|---|
| Open | Jung Allan | $97,000 | |
| Closed | Jung Allan | $87,000 | |
| Closed | Jung Allan | $84,950 |
Source: Public Records
Tax History
| Year | Tax Paid | Tax Assessment Tax Assessment Total Assessment is a certain percentage of the fair market value that is determined by local assessors to be the total taxable value of land and additions on the property. | Land | Improvement |
|---|---|---|---|---|
| 2025 | $4,349 | $329,700 | $118,200 | $211,500 |
| 2024 | $4,279 | $311,200 | $118,200 | $193,000 |
| 2023 | $4,085 | $284,900 | $102,800 | $182,100 |
| 2022 | $3,723 | $244,800 | $82,300 | $162,500 |
| 2021 | $3,474 | $213,400 | $65,800 | $147,600 |
| 2020 | $3,398 | $199,900 | $65,800 | $134,100 |
| 2019 | $3,229 | $179,400 | $59,200 | $120,200 |
| 2018 | $3,249 | $171,800 | $59,200 | $112,600 |
| 2017 | $3,121 | $162,400 | $59,200 | $103,200 |
| 2016 | $3,019 | $146,500 | $43,300 | $103,200 |
| 2015 | $2,940 | $146,500 | $43,300 | $103,200 |
| 2014 | $2,863 | $146,500 | $43,300 | $103,200 |
Source: Public Records
Map
Nearby Homes
- 49 Strasburg Rd
- 29 Steele St
- 22 Bittersweet Blvd
- 50 Sophia Dr
- 4 Stockholm St
- 73 Sophia Dr
- 6 Beckman St
- 30 Ekman St
- 50 Whipple St
- 6 Epworth St
- 154 Pakachoag St
- 557 SW Cutoff Unit 17
- 557 SW Cutoff Unit 55
- 557 SW Cutoff Unit 60
- 204-212 Hampton St
- 1034 Southbridge St
- 47 Gibbs St
- 457 Granite St
- 464-466 Granite St
- 460-462 Granite St
Your Personal Tour Guide
Ask me questions while you tour the home.