M
Seller's Agent in 2019
MARY SERRILLI
KELLER WILLIAMS INTEGRITY
Estimated Value: $622,000 - $701,000
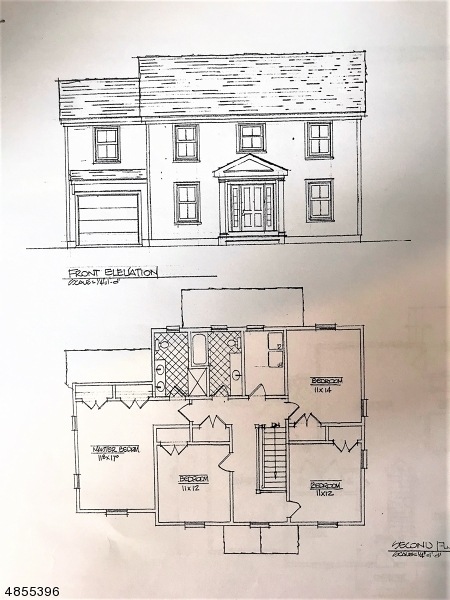
Beautiful center hall colonial currently under construction. Conveniently located to Rt 80/46/10. Desirable open concept floor plan. Hdw on main floor and upstairs in hallway landing, bedrooms carpeted, kitchen w/large center island, granite counter tops, walkout to deck, Still time to customize finishes! Plans available on request. Sq ft approx. CONSTRUCTION BEGINS APRIL/MAY - COMPLETED October/November. Choose your tile/flooring and cabinets/granite. Busy season. Houses are going quickly! Don't delay! Pictures are not a true representation of completed project. Come see the model at 57 Railroad.
Last Agent to Sell the Property
MARY SERRILLI
KELLER WILLIAMS INTEGRITY Listed on: 12/05/2018
Last Buyer's Agent
DANIELLE HILLIKER
KL SOTHEBY'S INT'L. REALTY
| Date | Buyer | Sale Price | Title Company |
|---|---|---|---|
| Der Walt Ryan | $374,900 | Chicago Title Insurance Co |
| Date | Status | Borrower | Loan Amount |
|---|---|---|---|
| Open | Der Walt Ryan | $356,150 |
| Date | Event | Price | List to Sale | Price per Sq Ft |
|---|---|---|---|---|
| 12/04/2019 12/04/19 | Sold | $374,900 | 0.0% | $167 / Sq Ft |
| 09/25/2019 09/25/19 | Pending | -- | -- | -- |
| 12/05/2018 12/05/18 | For Sale | $374,900 | -- | $167 / Sq Ft |
| Year | Tax Paid | Tax Assessment Tax Assessment Total Assessment is a certain percentage of the fair market value that is determined by local assessors to be the total taxable value of land and additions on the property. | Land | Improvement |
|---|---|---|---|---|
| 2025 | $12,475 | $365,100 | $100,800 | $264,300 |
| 2024 | $12,585 | $365,100 | $100,800 | $264,300 |
| 2023 | $12,585 | $365,100 | $100,800 | $264,300 |
| 2022 | $11,402 | $365,100 | $100,800 | $264,300 |
| 2021 | $11,402 | $365,100 | $100,800 | $264,300 |
| 2020 | $3,697 | $120,200 | $120,200 | $0 |
M
Seller's Agent in 2019
MARY SERRILLI
KELLER WILLIAMS INTEGRITY
D
Buyer's Agent in 2019
DANIELLE HILLIKER
KL SOTHEBY'S INT'L. REALTY
Source: Garden State MLS
MLS Number: 3519134
APN: 28-00008-0000-00036-03
Disclaimer: Certain information contained herein is derived from information provided by parties other than Homes.com. All information provided is deemed reliable, but is not guaranteed to be accurate and should be independently verified.
![]() The data relating to real estate for sale on this website comes in part from the IDX Program of Garden State Multiple Listing Service, L.L.C. Real estate listings held by other brokerage firms are marked as IDX Listing.
The data relating to real estate for sale on this website comes in part from the IDX Program of Garden State Multiple Listing Service, L.L.C. Real estate listings held by other brokerage firms are marked as IDX Listing.
Information deemed reliable but not guaranteed.
Copyright © 2025 Garden State Multiple Listing Service, L.L.C. All rights reserved.
Notice: The dissemination of listings on this website does not constitute the consent required by N.J.A.C. 11:5.6.1 (n) for the advertisement of listings exclusively for sale by another broker. Any such consent must be obtained in writing from the listing broker.
This information is being provided for Consumers’ personal, non-commercial use and may not be used for any purpose other than to identify prospective properties Consumers may be interested in purchasing.