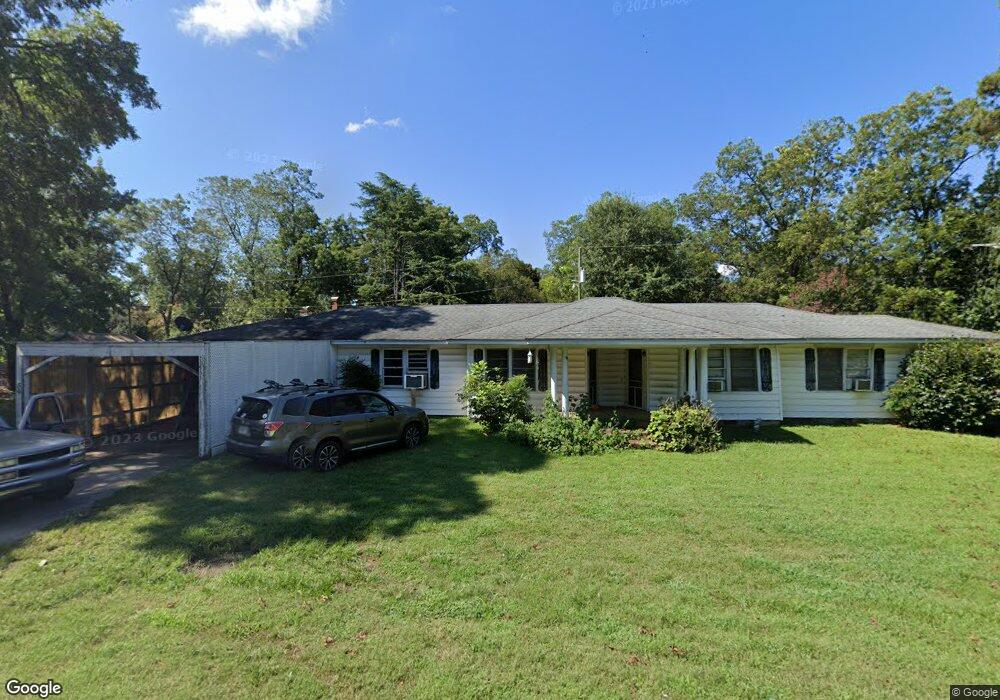
59 W Railroad St Bowman, GA 30624
Estimated Value: $106,094 - $217,000
--
Bed
2
Baths
1,825
Sq Ft
$97/Sq Ft
Est. Value
About This Home
This home is located at 59 W Railroad St, Bowman, GA 30624 and is currently estimated at $176,774, approximately $96 per square foot. 59 W Railroad St is a home located in Elbert County with nearby schools including Elbert County Elementary School, Elbert County Primary School, and Elbert County Middle School.
Ownership History
Date
Name
Owned For
Owner Type
Purchase Details
Closed on
Jan 1, 1963
Current Estimated Value
Create a Home Valuation Report for This Property
The Home Valuation Report is an in-depth analysis detailing your home's value as well as a comparison with similar homes in the area
Home Values in the Area
Average Home Value in this Area
Purchase History
| Date | Buyer | Sale Price | Title Company |
|---|---|---|---|
| -- | -- | -- |
Source: Public Records
Tax History Compared to Growth
Tax History
| Year | Tax Paid | Tax Assessment Tax Assessment Total Assessment is a certain percentage of the fair market value that is determined by local assessors to be the total taxable value of land and additions on the property. | Land | Improvement |
|---|---|---|---|---|
| 2024 | $878 | $35,702 | $4,000 | $31,702 |
| 2023 | $878 | $35,702 | $4,000 | $31,702 |
| 2022 | $700 | $28,452 | $3,400 | $25,052 |
| 2021 | $705 | $28,452 | $3,400 | $25,052 |
| 2020 | $684 | $24,807 | $4,000 | $20,807 |
| 2019 | $990 | $24,807 | $4,000 | $20,807 |
| 2018 | $1,011 | $34,751 | $4,000 | $30,751 |
| 2017 | $826 | $26,283 | $4,000 | $22,283 |
| 2016 | $771 | $26,283 | $4,000 | $22,283 |
| 2015 | -- | $26,283 | $4,000 | $22,283 |
| 2014 | -- | $26,283 | $4,000 | $22,283 |
| 2013 | -- | $29,509 | $4,000 | $25,509 |
Source: Public Records
Map
Nearby Homes
- 0 Bowers St Unit LOT 1-8 10576344
- 0 Bowers St Unit LOT 1-8 CL335681
- 227 Rehoboth Rd
- 1963 Rehoboth Rd Unit EXTENSION
- 1963 Rehoboth Rd
- 0 Five Forks Rd Unit 10619685
- 3075 Sycamore Rd
- 3075 Sycamore Rd
- 2198 Bennett Rd
- 2732 Zero O Dr
- 2587 Quill Rd
- 0 Jess Guest Rd Unit CL336922
- 0 Jess Guest Rd Unit 10586921
- 0 LOT A Jess Guest Rd
- 2851 Bowman Hwy
- 2784 Stanley Maxwell Rd
- 0 Dusty Rd Unit 10569563
- 0 Dusty Rd Unit 7619983
- 0 Fork Creek Rd Unit 10616779
- 0 Fork Creek Rd Unit 7659678
- 83 Prince Ave
- 63 Prince Ave
- 41 W Railroad St
- 55 Prince Ave
- 0 Prince Ave Unit 7573244
- 91 Prince Ave
- 43 W Church St
- 45 Prince Ave
- 0 W Church St Unit 20243450
- 0 W Church St Unit 7147424
- 2 Public Square
- 37 Park Dr
- 93 W Railroad St
- 33 W Railroad St
- 5 Public Square
- 6 Public Square Unit 7
- 0 Public Square Unit 8737883
- 0 Public Square Unit 8593546
- 37 Prince Ave
- 103 W Railroad St Unit 103/99