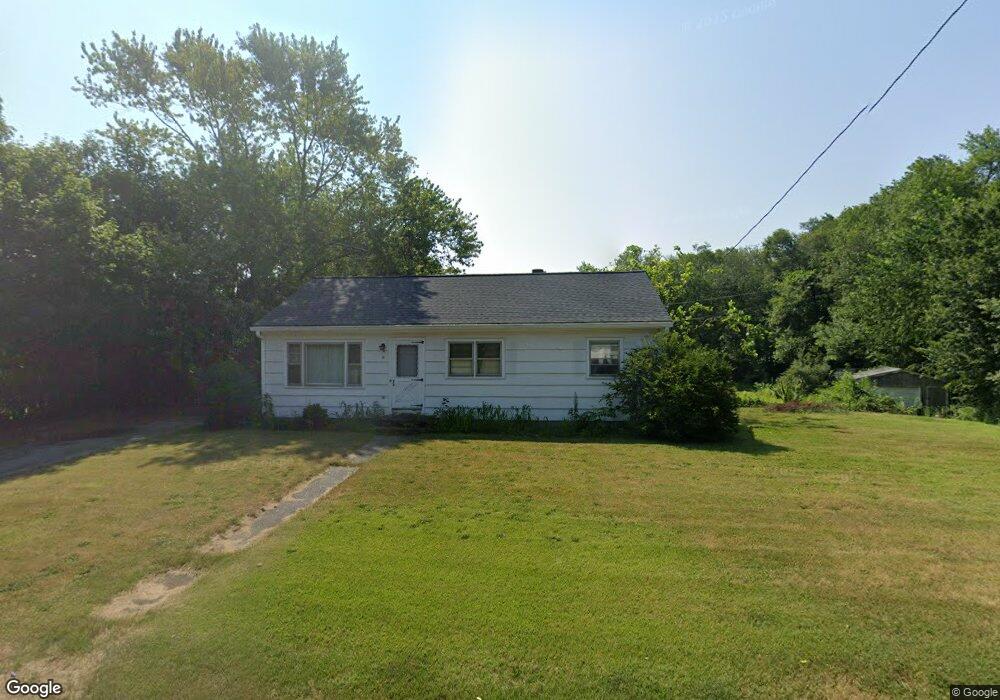
59 Watson St Seekonk, MA 02771
Monroes-South Seekonk NeighborhoodEstimated Value: $431,000 - $539,000
3
Beds
1
Bath
1,284
Sq Ft
$375/Sq Ft
Est. Value
About This Home
This home is located at 59 Watson St, Seekonk, MA 02771 and is currently estimated at $480,976, approximately $374 per square foot. 59 Watson St is a home located in Bristol County with nearby schools including Seekonk High School, St Mary Academy-Bay View, and Providence Country Day School.
Ownership History
Date
Name
Owned For
Owner Type
Purchase Details
Closed on
Jan 29, 1987
Sold by
Decosta Louis R
Bought by
Stgermain Maurice R
Current Estimated Value
Home Financials for this Owner
Home Financials are based on the most recent Mortgage that was taken out on this home.
Original Mortgage
$65,000
Interest Rate
9.26%
Mortgage Type
Purchase Money Mortgage
Create a Home Valuation Report for This Property
The Home Valuation Report is an in-depth analysis detailing your home's value as well as a comparison with similar homes in the area
Home Values in the Area
Average Home Value in this Area
Purchase History
| Date | Buyer | Sale Price | Title Company |
|---|---|---|---|
| Stgermain Maurice R | $105,000 | -- |
Source: Public Records
Mortgage History
| Date | Status | Borrower | Loan Amount |
|---|---|---|---|
| Open | Stgermain Maurice R | $62,700 | |
| Closed | Stgermain Maurice R | $90,000 | |
| Closed | Stgermain Maurice R | $19,000 | |
| Closed | Stgermain Maurice R | $65,000 |
Source: Public Records
Tax History Compared to Growth
Tax History
| Year | Tax Paid | Tax Assessment Tax Assessment Total Assessment is a certain percentage of the fair market value that is determined by local assessors to be the total taxable value of land and additions on the property. | Land | Improvement |
|---|---|---|---|---|
| 2025 | $4,718 | $382,000 | $178,600 | $203,400 |
| 2024 | $4,570 | $370,000 | $178,600 | $191,400 |
| 2023 | $4,141 | $315,900 | $160,900 | $155,000 |
| 2022 | $3,656 | $288,200 | $154,600 | $133,600 |
| 2021 | $3,656 | $269,400 | $138,200 | $131,200 |
| 2020 | $3,483 | $264,500 | $138,100 | $126,400 |
| 2019 | $3,268 | $250,200 | $129,800 | $120,400 |
| 2018 | $3,201 | $239,800 | $126,300 | $113,500 |
| 2017 | $3,109 | $231,000 | $123,100 | $107,900 |
| 2016 | $3,009 | $224,400 | $123,100 | $101,300 |
| 2015 | $2,950 | $223,000 | $123,100 | $99,900 |
Source: Public Records
Map
Nearby Homes
- 0 Mabel Dr
- 454 Fall River Ave
- 7 Jill Ct
- 25 Pimental Dr
- 698 Fall River Ave
- 42 Tee Jay Dr
- 195 Barney Ave
- 57 Redwood Ln
- 5 Connor Ln
- 249 Barneyville Rd
- 6 Hazelton Rd
- 203 Providence St Bldr Lot 5
- 22 Mayfield Rd
- 205 Providence St Bldr Lot 3
- 420 Chestnut St
- 15 George w Finnerty Rd
- 6 Kenmore Ct
- 127 Mason St
- 36 Woodbine St
- 134 Mason St