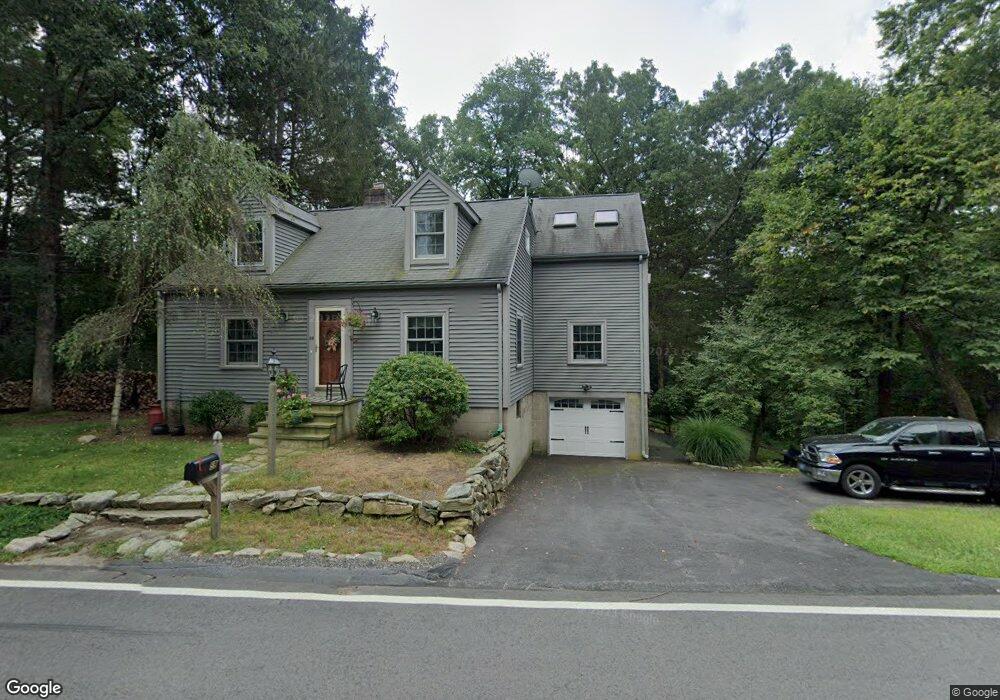
59 West St Medway, MA 02053
Estimated Value: $555,000 - $669,000
2
Beds
3
Baths
1,602
Sq Ft
$379/Sq Ft
Est. Value
About This Home
This home is located at 59 West St, Medway, MA 02053 and is currently estimated at $607,325, approximately $379 per square foot. 59 West St is a home located in Norfolk County with nearby schools including John D. McGovern Elementary School, Burke-Memorial Elementary, and Medway Middle School.
Ownership History
Date
Name
Owned For
Owner Type
Purchase Details
Closed on
Aug 29, 1988
Sold by
Mikolop Francis P
Bought by
Cenedella Peter F
Current Estimated Value
Home Financials for this Owner
Home Financials are based on the most recent Mortgage that was taken out on this home.
Original Mortgage
$129,900
Interest Rate
10.36%
Mortgage Type
Purchase Money Mortgage
Create a Home Valuation Report for This Property
The Home Valuation Report is an in-depth analysis detailing your home's value as well as a comparison with similar homes in the area
Home Values in the Area
Average Home Value in this Area
Purchase History
| Date | Buyer | Sale Price | Title Company |
|---|---|---|---|
| Cenedella Peter F | $140,000 | -- |
Source: Public Records
Mortgage History
| Date | Status | Borrower | Loan Amount |
|---|---|---|---|
| Open | Cenedella Peter F | $120,000 | |
| Closed | Cenedella Peter F | $129,900 |
Source: Public Records
Tax History Compared to Growth
Tax History
| Year | Tax Paid | Tax Assessment Tax Assessment Total Assessment is a certain percentage of the fair market value that is determined by local assessors to be the total taxable value of land and additions on the property. | Land | Improvement |
|---|---|---|---|---|
| 2025 | $6,413 | $450,000 | $269,000 | $181,000 |
| 2024 | $6,480 | $450,000 | $269,000 | $181,000 |
| 2023 | $6,296 | $395,000 | $231,700 | $163,300 |
| 2022 | $6,161 | $363,900 | $206,900 | $157,000 |
| 2021 | $5,362 | $307,100 | $167,600 | $139,500 |
| 2020 | $5,122 | $292,700 | $149,000 | $143,700 |
| 2019 | $5,235 | $308,500 | $163,900 | $144,600 |
| 2018 | $5,030 | $284,800 | $141,500 | $143,300 |
| 2017 | $5,320 | $296,900 | $157,300 | $139,600 |
| 2016 | $4,794 | $264,700 | $125,100 | $139,600 |
| 2015 | $4,606 | $252,500 | $111,700 | $140,800 |
| 2014 | $4,819 | $255,800 | $119,200 | $136,600 |
Source: Public Records
Map
Nearby Homes
- 39 West St
- 9 Tulip Way
- 22 Granite St
- 6 Rainbow Dr
- 4 Deerfield Rd
- 462 Hartford Ave
- 0 Old Log Lane (Farm St) Unit 73416329
- 6 Freedom Trail
- 455 Hartford Ave
- 78 Fisher St
- 5 Fales St
- 220 Main St Unit 220
- 85 Fisher St
- 176 Main St Unit 3
- 18 Mary Anne Dr
- 28 Wellington St
- 14 Hawthorne Village Unit D
- 21 Riverside Rd
- 951 Pond St
- 5 Richardson St