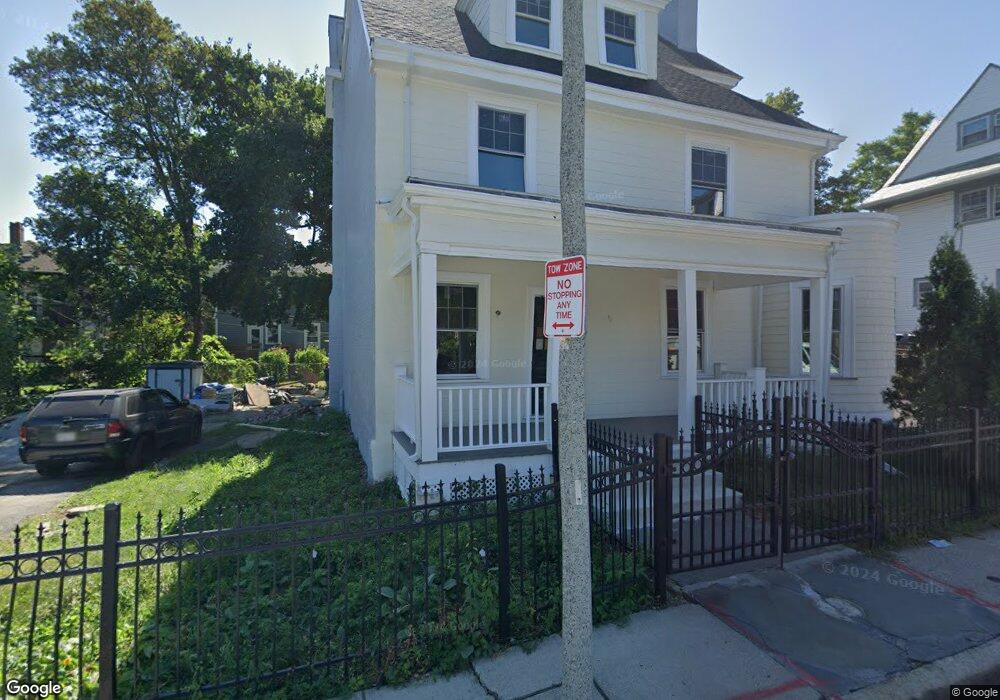
59 Whiting St Roxbury, MA 02119
Sav-Mor NeighborhoodEstimated Value: $792,000 - $913,000
5
Beds
3
Baths
3,165
Sq Ft
$270/Sq Ft
Est. Value
About This Home
This home is located at 59 Whiting St, Roxbury, MA 02119 and is currently estimated at $853,440, approximately $269 per square foot. 59 Whiting St is a home located in Suffolk County with nearby schools including Dudley Street Neighborhood Charter School, City on a Hill Charter Public School, and Paige Academy.
Ownership History
Date
Name
Owned For
Owner Type
Purchase Details
Closed on
Jun 30, 2023
Sold by
Morales Domingo
Bought by
Domingo Morales Rt and Morales
Current Estimated Value
Home Financials for this Owner
Home Financials are based on the most recent Mortgage that was taken out on this home.
Original Mortgage
$637,500
Interest Rate
6.39%
Mortgage Type
Purchase Money Mortgage
Purchase Details
Closed on
Jun 28, 2023
Sold by
Morrison Ft and Morrison
Bought by
Morales Domingo
Home Financials for this Owner
Home Financials are based on the most recent Mortgage that was taken out on this home.
Original Mortgage
$637,500
Interest Rate
6.39%
Mortgage Type
Purchase Money Mortgage
Purchase Details
Closed on
Apr 29, 2019
Sold by
Morrison Siebena
Bought by
Morrison Ft and Morrison
Purchase Details
Closed on
Feb 11, 2011
Sold by
Morrison Edward L and Morrison Siebena L
Bought by
Morrison Siebena L
Create a Home Valuation Report for This Property
The Home Valuation Report is an in-depth analysis detailing your home's value as well as a comparison with similar homes in the area
Home Values in the Area
Average Home Value in this Area
Purchase History
| Date | Buyer | Sale Price | Title Company |
|---|---|---|---|
| Domingo Morales Rt | -- | None Available | |
| Morales Domingo | $850,000 | None Available | |
| Morrison Ft | -- | -- | |
| Morrison Siebena L | -- | -- | |
| Morrison Siebena L | -- | -- |
Source: Public Records
Mortgage History
| Date | Status | Borrower | Loan Amount |
|---|---|---|---|
| Previous Owner | Morales Domingo | $637,500 |
Source: Public Records
Tax History Compared to Growth
Tax History
| Year | Tax Paid | Tax Assessment Tax Assessment Total Assessment is a certain percentage of the fair market value that is determined by local assessors to be the total taxable value of land and additions on the property. | Land | Improvement |
|---|---|---|---|---|
| 2025 | $6,813 | $588,300 | $258,600 | $329,700 |
| 2024 | $5,725 | $525,200 | $203,700 | $321,500 |
| 2023 | $5,272 | $490,900 | $190,400 | $300,500 |
| 2022 | $4,856 | $446,300 | $173,100 | $273,200 |
| 2021 | $4,409 | $413,200 | $160,300 | $252,900 |
| 2020 | $3,968 | $375,800 | $148,700 | $227,100 |
| 2019 | $3,702 | $351,200 | $114,800 | $236,400 |
| 2018 | $3,406 | $325,000 | $114,800 | $210,200 |
| 2017 | $3,442 | $325,000 | $114,800 | $210,200 |
| 2016 | $3,192 | $290,200 | $114,800 | $175,400 |
| 2015 | $2,831 | $233,800 | $87,400 | $146,400 |
| 2014 | $2,711 | $215,500 | $87,400 | $128,100 |
Source: Public Records
Map
Nearby Homes
- 101 Mount Pleasant Ave
- 33 Copeland Park Unit C
- 20 Rockville Park
- 22 Rockville Park
- 108 Mount Pleasant Ave Unit 108R
- 30 Copeland St Unit 1
- 7 Langford Park Unit 3
- 59 Perrin St
- 59 Perrin St Unit 1
- 80 Blue Hill Ave Unit 5
- 2 Mount Pleasant Place Unit 2
- 22 Alaska St
- 45 Woodville St
- 119 Blue Hill Ave
- 250 Dudley St Unit 1
- 10 Rockland St Unit 4
- 37 Regent St Unit 2
- 31 Alaska St
- 64 Alpine St Unit 104
- 64 Alpine St Unit 304
- 56 Moreland St
- 37 Fairland St
- 33 Fairland St
- 60 Moreland St
- 52 Moreland St Unit 54
- 64 Moreland St
- 29 Fairland St
- 29 Fairland St Unit 29 Fairland St Whole
- 29 Fairland St Unit 29 Fairland St - Roo
- 50 Moreland St
- 48 Moreland St Unit 3
- 48 Moreland St Unit 2
- 48 Moreland St Unit 1
- 65 Winthrop St
- 67 Whiting St
- 67 Whiting St Unit 1
- 67 Winthrop St
- 46 Moreland St
- 69 Winthrop St
- 59 Winthrop St