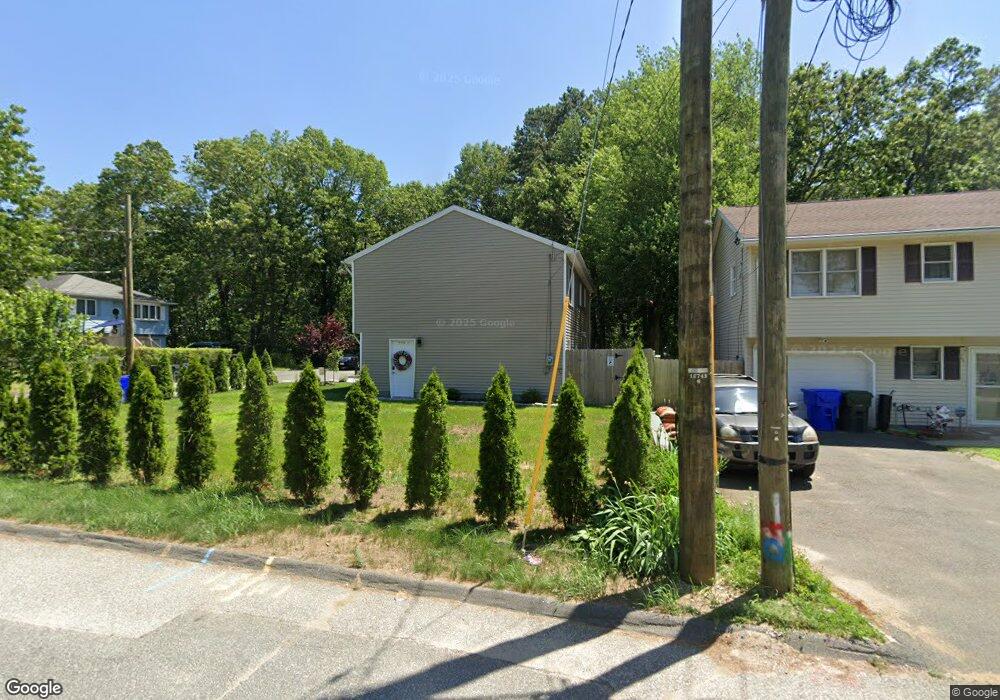
59 Wing St Indian Orchard, MA 01151
Estimated Value: $232,000 - $298,000
4
Beds
2
Baths
1,034
Sq Ft
$257/Sq Ft
Est. Value
About This Home
This home is located at 59 Wing St, Indian Orchard, MA 01151 and is currently estimated at $266,021, approximately $257 per square foot. 59 Wing St is a home located in Hampden County with nearby schools including Indian Orchard Elementary School, John F. Kennedy Academy, and Roger L. Putnam Vocational Technical Academy.
Ownership History
Date
Name
Owned For
Owner Type
Purchase Details
Closed on
Dec 23, 2024
Sold by
Rivera Juanita and Martinez Mary J
Bought by
Martinez Mary J
Current Estimated Value
Purchase Details
Closed on
Aug 19, 1992
Sold by
Turn Key Homes Inc
Bought by
Rivera Juanita
Purchase Details
Closed on
Jul 2, 1992
Sold by
Flinner James C and Flinner Eila M
Bought by
Turn Key Homes Inc
Create a Home Valuation Report for This Property
The Home Valuation Report is an in-depth analysis detailing your home's value as well as a comparison with similar homes in the area
Home Values in the Area
Average Home Value in this Area
Purchase History
| Date | Buyer | Sale Price | Title Company |
|---|---|---|---|
| Martinez Mary J | -- | None Available | |
| Martinez Mary J | -- | None Available | |
| Rivera Juanita | $89,000 | -- | |
| Turn Key Homes Inc | $23,000 | -- | |
| Rivera Juanita | $89,000 | -- |
Source: Public Records
Mortgage History
| Date | Status | Borrower | Loan Amount |
|---|---|---|---|
| Previous Owner | Turn Key Homes Inc | $13,000 |
Source: Public Records
Tax History Compared to Growth
Tax History
| Year | Tax Paid | Tax Assessment Tax Assessment Total Assessment is a certain percentage of the fair market value that is determined by local assessors to be the total taxable value of land and additions on the property. | Land | Improvement |
|---|---|---|---|---|
| 2025 | $3,766 | $240,200 | $43,200 | $197,000 |
| 2024 | $3,658 | $227,800 | $40,400 | $187,400 |
| 2023 | $3,505 | $205,600 | $33,100 | $172,500 |
| 2022 | $3,280 | $174,300 | $31,000 | $143,300 |
| 2021 | $3,109 | $164,500 | $28,200 | $136,300 |
| 2020 | $2,924 | $149,700 | $28,200 | $121,500 |
| 2019 | $2,692 | $136,800 | $29,200 | $107,600 |
| 2018 | $2,621 | $133,200 | $29,200 | $104,000 |
| 2017 | $2,454 | $124,800 | $24,800 | $100,000 |
| 2016 | $2,363 | $120,200 | $24,800 | $95,400 |
| 2015 | $2,286 | $116,200 | $24,800 | $91,400 |
Source: Public Records
Map
Nearby Homes