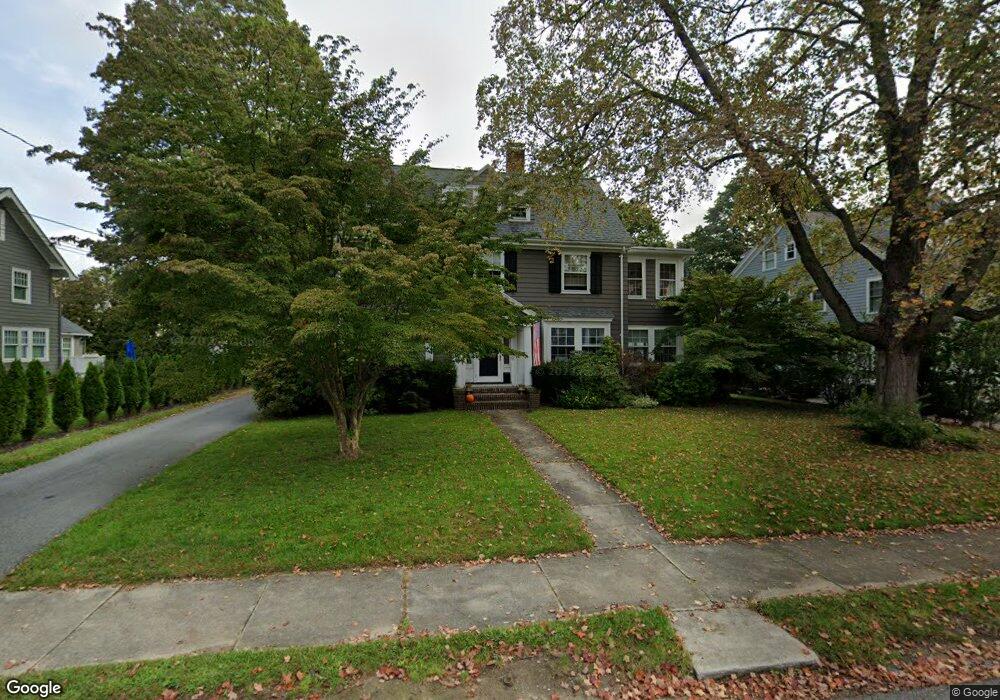
59 Yale St Winchester, MA 01890
The Flats NeighborhoodEstimated Value: $1,918,113 - $2,383,000
5
Beds
3
Baths
2,998
Sq Ft
$731/Sq Ft
Est. Value
About This Home
This home is located at 59 Yale St, Winchester, MA 01890 and is currently estimated at $2,192,028, approximately $731 per square foot. 59 Yale St is a home located in Middlesex County with nearby schools including Vinson-Owen Elementary School, McCall Middle School, and Winchester High School.
Ownership History
Date
Name
Owned For
Owner Type
Purchase Details
Closed on
Jun 27, 2001
Sold by
Rich Robert D and Rich Suzanne R
Bought by
Foot Jonathan T and Foot Barbara D
Current Estimated Value
Purchase Details
Closed on
Jun 29, 2000
Sold by
Tingley Nathaniel R and Tingley Alice C
Bought by
Rich Robert D and Rich Suzanne R
Purchase Details
Closed on
Jul 21, 1995
Sold by
Oconnor William P and Oconnor Gloria
Bought by
Tingley Nathaniel R and Tingley Alice C
Create a Home Valuation Report for This Property
The Home Valuation Report is an in-depth analysis detailing your home's value as well as a comparison with similar homes in the area
Home Values in the Area
Average Home Value in this Area
Purchase History
| Date | Buyer | Sale Price | Title Company |
|---|---|---|---|
| Foot Jonathan T | $877,250 | -- | |
| Rich Robert D | $766,500 | -- | |
| Tingley Nathaniel R | $440,000 | -- |
Source: Public Records
Mortgage History
| Date | Status | Borrower | Loan Amount |
|---|---|---|---|
| Open | Tingley Nathaniel R | $620,000 | |
| Closed | Tingley Nathaniel R | $632,000 |
Source: Public Records
Tax History Compared to Growth
Tax History
| Year | Tax Paid | Tax Assessment Tax Assessment Total Assessment is a certain percentage of the fair market value that is determined by local assessors to be the total taxable value of land and additions on the property. | Land | Improvement |
|---|---|---|---|---|
| 2025 | $190 | $1,716,000 | $1,175,500 | $540,500 |
| 2024 | $18,564 | $1,638,500 | $1,141,000 | $497,500 |
| 2023 | $18,439 | $1,562,600 | $1,071,800 | $490,800 |
| 2022 | $17,923 | $1,432,700 | $968,100 | $464,600 |
| 2021 | $16,829 | $1,311,700 | $847,100 | $464,600 |
| 2020 | $16,252 | $1,311,700 | $847,100 | $464,600 |
| 2019 | $14,629 | $1,208,000 | $743,400 | $464,600 |
| 2018 | $14,354 | $1,177,500 | $726,100 | $451,400 |
| 2017 | $13,702 | $1,115,800 | $690,600 | $425,200 |
| 2016 | $12,880 | $1,102,700 | $690,600 | $412,100 |
| 2015 | $12,429 | $1,023,800 | $627,500 | $396,300 |
| 2014 | $12,074 | $953,700 | $570,500 | $383,200 |
Source: Public Records
Map
Nearby Homes
- 44 Cabot St
- 89 Wildwood St
- 6 Ivy Cir
- 1 Copley St
- 32 Woodside Rd
- 15 Wildwood St
- 104 Church St
- 6 Wyman Ct Unit 6
- 4 Wyman Ct Unit 4
- 10 Sheffield Rd
- 9 Norfolk Rd
- 19 Glengarry Rd
- 2 Everett Ave
- 46 Church St
- 149 Horn Pond Brook Rd
- 62 Richardson St
- 53 Bacon St
- 36 Elmwood Ave Unit 2
- 666 Main St Unit 312
- 9 Sylvester Ct