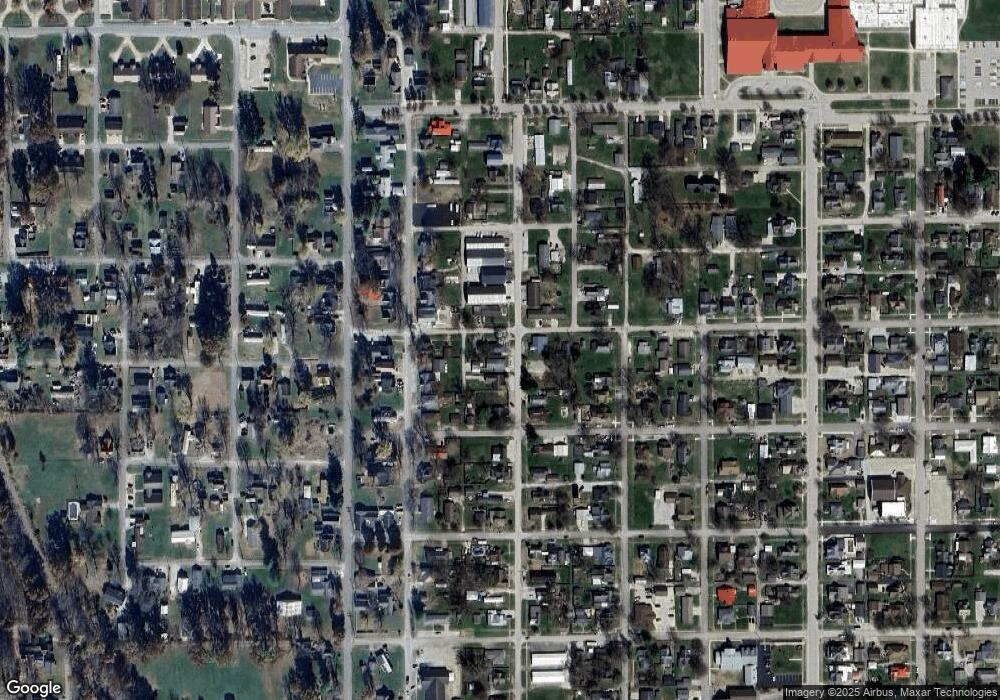
590 3rd St NW Linton, IN 47441
Estimated Value: $86,000 - $148,000
3
Beds
1
Bath
1,408
Sq Ft
$83/Sq Ft
Est. Value
About This Home
This home is located at 590 3rd St NW, Linton, IN 47441 and is currently estimated at $117,092, approximately $83 per square foot. 590 3rd St NW is a home located in Greene County with nearby schools including Linton-Stockton Elementary School, Linton-Stockton Junior High School, and Linton-Stockton High School.
Ownership History
Date
Name
Owned For
Owner Type
Purchase Details
Closed on
Mar 28, 2013
Sold by
Russell Scott A and Russell Sara L
Bought by
Haines Joann
Current Estimated Value
Purchase Details
Closed on
Jul 3, 2008
Sold by
Anderson Lisa A
Bought by
Russell Scott A and Russell Sara L
Home Financials for this Owner
Home Financials are based on the most recent Mortgage that was taken out on this home.
Original Mortgage
$45,781
Interest Rate
6.15%
Mortgage Type
FHA
Create a Home Valuation Report for This Property
The Home Valuation Report is an in-depth analysis detailing your home's value as well as a comparison with similar homes in the area
Home Values in the Area
Average Home Value in this Area
Purchase History
| Date | Buyer | Sale Price | Title Company |
|---|---|---|---|
| Haines Joann | -- | None Available | |
| Russell Scott A | -- | None Available |
Source: Public Records
Mortgage History
| Date | Status | Borrower | Loan Amount |
|---|---|---|---|
| Previous Owner | Russell Scott A | $45,781 |
Source: Public Records
Tax History Compared to Growth
Tax History
| Year | Tax Paid | Tax Assessment Tax Assessment Total Assessment is a certain percentage of the fair market value that is determined by local assessors to be the total taxable value of land and additions on the property. | Land | Improvement |
|---|---|---|---|---|
| 2024 | $1,240 | $57,700 | $5,400 | $52,300 |
| 2023 | $928 | $57,200 | $5,400 | $51,800 |
| 2022 | $595 | $58,900 | $5,400 | $53,500 |
| 2021 | $560 | $54,200 | $5,400 | $48,800 |
| 2020 | $556 | $54,200 | $5,400 | $48,800 |
| 2019 | $560 | $54,200 | $5,400 | $48,800 |
| 2018 | $560 | $54,200 | $5,400 | $48,800 |
| 2017 | $547 | $53,700 | $5,400 | $48,300 |
| 2016 | $494 | $51,200 | $5,400 | $45,800 |
| 2014 | $469 | $53,000 | $5,400 | $47,600 |
| 2013 | -- | $52,500 | $5,400 | $47,100 |
Source: Public Records
Map
Nearby Homes