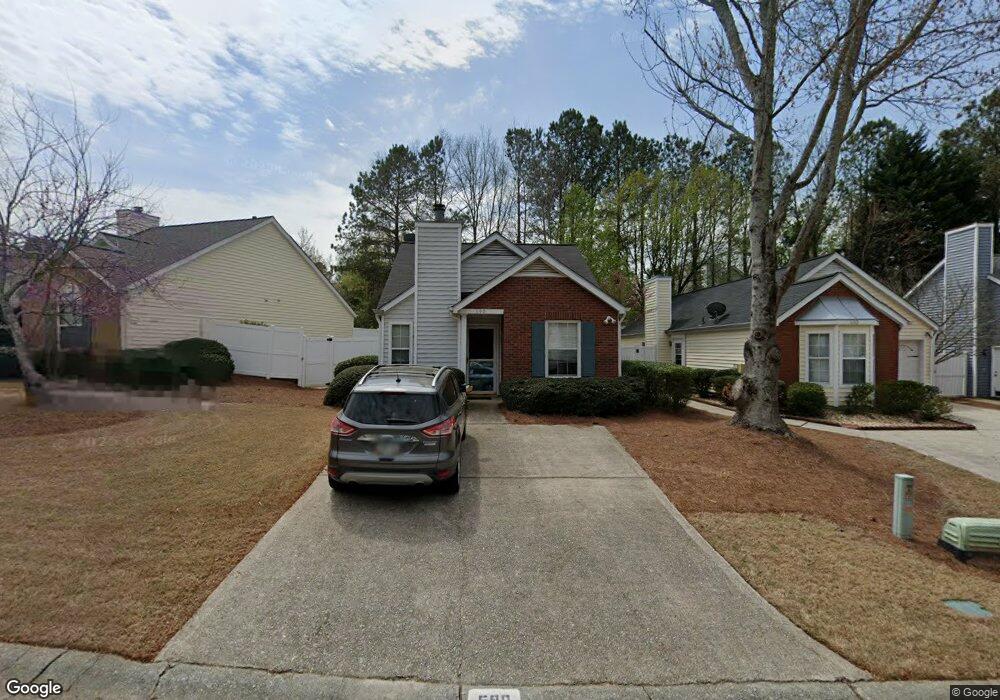
590 Crossbridge Alley Unit 1 Alpharetta, GA 30022
Newtown NeighborhoodEstimated Value: $304,000 - $349,000
2
Beds
2
Baths
806
Sq Ft
$406/Sq Ft
Est. Value
About This Home
This home is located at 590 Crossbridge Alley Unit 1, Alpharetta, GA 30022 and is currently estimated at $327,059, approximately $405 per square foot. 590 Crossbridge Alley Unit 1 is a home located in Fulton County with nearby schools including Dolvin Elementary School, Autrey Mill Middle School, and Johns Creek High School.
Ownership History
Date
Name
Owned For
Owner Type
Purchase Details
Closed on
Mar 14, 2016
Sold by
Franz Jana K
Bought by
Wells Angela G
Current Estimated Value
Home Financials for this Owner
Home Financials are based on the most recent Mortgage that was taken out on this home.
Original Mortgage
$116,000
Outstanding Balance
$91,813
Interest Rate
3.65%
Mortgage Type
New Conventional
Estimated Equity
$235,246
Purchase Details
Closed on
Jul 31, 2001
Sold by
Clemens Brian P
Bought by
Franz Jana K
Home Financials for this Owner
Home Financials are based on the most recent Mortgage that was taken out on this home.
Original Mortgage
$113,813
Interest Rate
7.19%
Mortgage Type
FHA
Purchase Details
Closed on
Dec 29, 1997
Sold by
Textor Karen E
Bought by
Clemens Brian P
Home Financials for this Owner
Home Financials are based on the most recent Mortgage that was taken out on this home.
Original Mortgage
$85,481
Interest Rate
7.07%
Mortgage Type
FHA
Purchase Details
Closed on
Sep 18, 1996
Sold by
Capers Alvin
Bought by
Textor Karen
Create a Home Valuation Report for This Property
The Home Valuation Report is an in-depth analysis detailing your home's value as well as a comparison with similar homes in the area
Home Values in the Area
Average Home Value in this Area
Purchase History
| Date | Buyer | Sale Price | Title Company |
|---|---|---|---|
| Wells Angela G | $145,000 | -- | |
| Franz Jana K | $115,600 | -- | |
| Clemens Brian P | $86,000 | -- | |
| Textor Karen | $79,400 | -- |
Source: Public Records
Mortgage History
| Date | Status | Borrower | Loan Amount |
|---|---|---|---|
| Open | Wells Angela G | $116,000 | |
| Previous Owner | Franz Jana K | $113,813 | |
| Previous Owner | Clemens Brian P | $85,481 | |
| Closed | Textor Karen | $0 |
Source: Public Records
Tax History Compared to Growth
Tax History
| Year | Tax Paid | Tax Assessment Tax Assessment Total Assessment is a certain percentage of the fair market value that is determined by local assessors to be the total taxable value of land and additions on the property. | Land | Improvement |
|---|---|---|---|---|
| 2025 | $1,491 | $120,000 | $32,600 | $87,400 |
| 2023 | $3,153 | $111,720 | $25,240 | $86,480 |
| 2022 | $1,414 | $90,680 | $22,240 | $68,440 |
| 2021 | $1,393 | $81,840 | $18,880 | $62,960 |
| 2020 | $1,394 | $72,760 | $19,640 | $53,120 |
| 2019 | $151 | $72,960 | $18,320 | $54,640 |
| 2018 | $1,992 | $61,160 | $14,080 | $47,080 |
| 2017 | $1,661 | $48,800 | $11,240 | $37,560 |
| 2016 | $1,221 | $48,800 | $11,240 | $37,560 |
| 2015 | $1,234 | $48,800 | $11,240 | $37,560 |
| 2014 | $1,117 | $44,720 | $12,040 | $32,680 |
Source: Public Records
Map
Nearby Homes
- 320 Outwood Mill Ct
- 10000 Barston Ct
- 10090 Jones Bridge Rd Unit 8
- 125 Thome Dr
- 120 Thome Dr
- 201 Downing Dr Unit 76
- 615 S Preston Ct
- 595 Oak Alley Way
- 10415 Plantation Bridge Dr
- 130 Forrest View Terrace
- 710 Weybridge Place
- 350 Waters Bend Way
- 10085 Old Woodland Entry
- 9715 Almaviva Dr
- 305 Birch Rill Dr
- 10515 Colony Glen Dr Unit 2
- 3273 Long Indian Creek Ct
- 3765 Redcoat Way
- 545 Oak Bridge Trail
- 3430 Waters Mill Dr
- 590 Crossbridge Alley
- 600 Crossbridge Alley
- 580 Crossbridge Alley
- 570 Crossbridge Alley Unit 1
- 610 Crossbridge Alley
- 430 Ferryman Ct
- 560 Crossbridge Alley
- 440 Ferryman Ct Unit 2
- 620 Crossbridge Alley
- 625 Crossbridge Alley
- 615 Crossbridge Alley
- 635 Crossbridge Alley
- 550 Crossbridge Alley
- 605 Crossbridge Alley
- 630 Crossbridge Alley
- 435 Ferryman Ct Unit 2
- 645 Crossbridge Alley
- 420 Ferryman Ct Unit 2
- 595 Crossbridge Alley
- 655 Crossbridge Alley