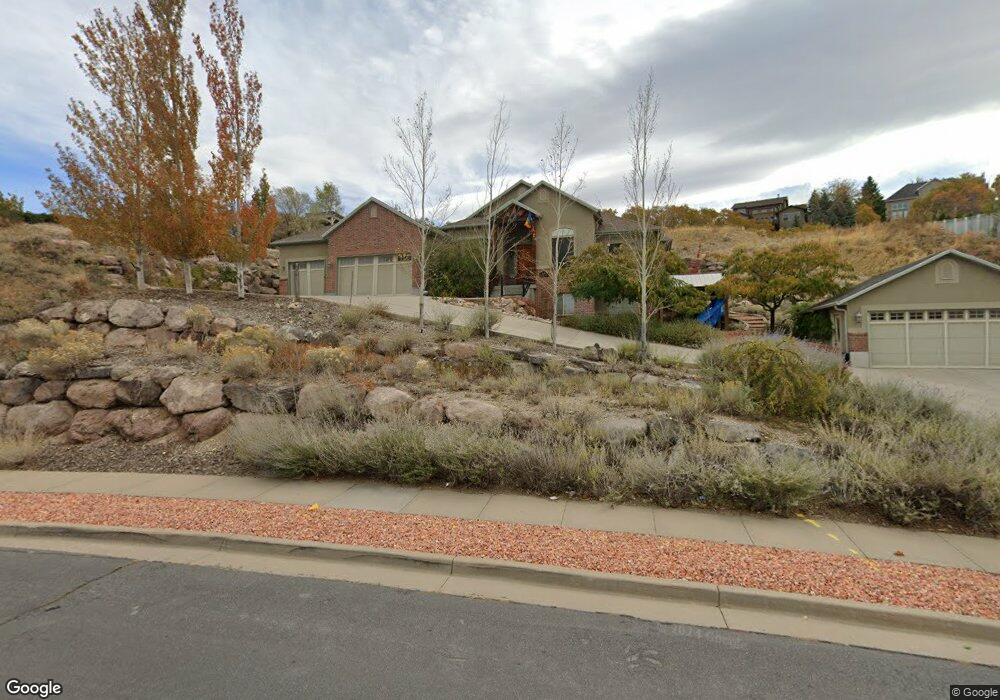
590 Dorthea Way North Salt Lake, UT 84054
Estimated Value: $687,000 - $1,026,000
3
Beds
4
Baths
1,998
Sq Ft
$440/Sq Ft
Est. Value
About This Home
This home is located at 590 Dorthea Way, North Salt Lake, UT 84054 and is currently estimated at $879,106, approximately $439 per square foot. 590 Dorthea Way is a home with nearby schools including Orchard School, South Davis Junior High School, and Woods Cross High School.
Ownership History
Date
Name
Owned For
Owner Type
Purchase Details
Closed on
Dec 7, 2011
Sold by
Olivares Carlos and Jamjian Marie Christine
Bought by
Olivares Carlos and Jamjian Marie Christine
Current Estimated Value
Home Financials for this Owner
Home Financials are based on the most recent Mortgage that was taken out on this home.
Original Mortgage
$167,000
Outstanding Balance
$17,978
Interest Rate
3.94%
Mortgage Type
New Conventional
Estimated Equity
$861,128
Purchase Details
Closed on
Oct 20, 2004
Sold by
Lone Peak Builders Inc
Bought by
Olivares Carlos and Jamjian Marie Christine
Home Financials for this Owner
Home Financials are based on the most recent Mortgage that was taken out on this home.
Original Mortgage
$296,000
Outstanding Balance
$147,085
Interest Rate
5.82%
Mortgage Type
Purchase Money Mortgage
Estimated Equity
$732,021
Purchase Details
Closed on
Mar 23, 2004
Sold by
Gregerson Homes Inc
Bought by
Welsh Adam D
Purchase Details
Closed on
Mar 22, 2004
Sold by
Welch Adam D
Bought by
Lone Peak Builders Inc
Create a Home Valuation Report for This Property
The Home Valuation Report is an in-depth analysis detailing your home's value as well as a comparison with similar homes in the area
Home Values in the Area
Average Home Value in this Area
Purchase History
| Date | Buyer | Sale Price | Title Company |
|---|---|---|---|
| Olivares Carlos | -- | Servicelink | |
| Olivares Carlos | -- | Guardian Title Company | |
| Welsh Adam D | -- | Brighton Title | |
| Lone Peak Builders Inc | -- | Brighton Title |
Source: Public Records
Mortgage History
| Date | Status | Borrower | Loan Amount |
|---|---|---|---|
| Open | Olivares Carlos | $167,000 | |
| Open | Olivares Carlos | $296,000 |
Source: Public Records
Tax History Compared to Growth
Tax History
| Year | Tax Paid | Tax Assessment Tax Assessment Total Assessment is a certain percentage of the fair market value that is determined by local assessors to be the total taxable value of land and additions on the property. | Land | Improvement |
|---|---|---|---|---|
| 2024 | $4,221 | $424,600 | $199,170 | $225,430 |
| 2023 | $4,317 | $785,000 | $251,162 | $533,838 |
| 2022 | $4,292 | $428,450 | $172,181 | $256,269 |
| 2021 | $4,291 | $650,000 | $239,216 | $410,784 |
| 2020 | $3,778 | $566,000 | $233,657 | $332,343 |
| 2019 | $3,736 | $546,000 | $222,134 | $323,866 |
| 2018 | $3,736 | $540,000 | $198,161 | $341,839 |
| 2016 | $3,188 | $245,080 | $74,500 | $170,580 |
| 2015 | $3,346 | $247,115 | $74,500 | $172,615 |
| 2014 | $2,619 | $197,186 | $74,500 | $122,686 |
| 2013 | -- | $220,483 | $82,107 | $138,376 |
Source: Public Records
Map
Nearby Homes
- 285 Constitution Way
- 720 Freedom Cir
- 585 Marialana Way
- 398 Lofty Ln
- 520 Lacey Way
- 151 S Bernice Way
- 271 E Eagle Ridge Dr
- 93 N Valley View Dr
- 609 Parkway Dr
- 275 Eagle Way
- 2420 S Orchard Dr
- 79 N Orchard Dr
- 178 N Valley View Dr
- 311 Edgemont Dr
- 53 N Foxhill Rd
- 302 Odell Ln
- 266 Oak Dr
- 246 N Glenwood Way
- 755 Parkway Dr
- 310 N 675 E
- 590 Dorthea Way
- 192 Coventry Ln
- 202 Constitution Way
- 581 Dorthea Way
- 182 Coventry Ln Unit Basement
- 570 Dorthea Way Unit 20
- 222 Constitution Way
- 308 Lofty Ln
- 308 Lofty Ln Unit 509
- 565 Dorthea Way
- 172 S Coverntry N
- 172 Coventry Ln
- 298 Lofty Ln
- 298 Lofty Ln Unit 510
- 203 Constitution Way
- 203 Coventry Ln
- 253 Eugene St
- 253 Eugene St Unit 24
- 172 S Constitution Way
- 213 Constitution Way