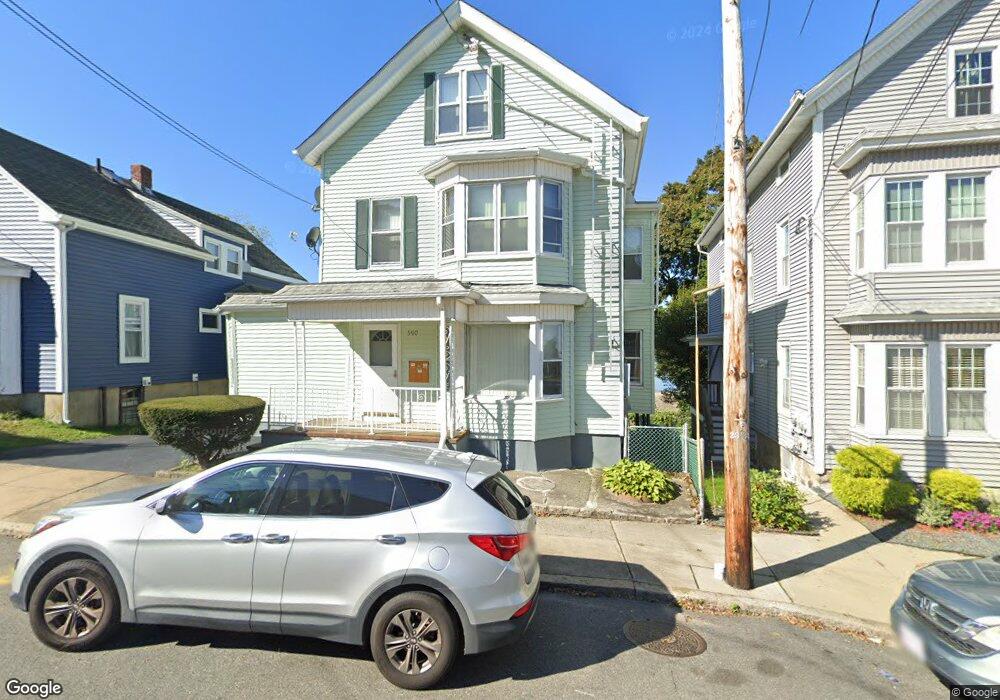
590 Durfee St Fall River, MA 02720
Lower Highlands NeighborhoodEstimated Value: $641,000 - $710,000
7
Beds
4
Baths
3,892
Sq Ft
$173/Sq Ft
Est. Value
About This Home
This home is located at 590 Durfee St, Fall River, MA 02720 and is currently estimated at $672,000, approximately $172 per square foot. 590 Durfee St is a home located in Bristol County with nearby schools including Mary Fonseca Elementary School, Morton Middle School, and B M C Durfee High School.
Ownership History
Date
Name
Owned For
Owner Type
Purchase Details
Closed on
Jun 22, 2022
Sold by
Lourenco Jose M and Lourenco Maria E
Bought by
Lourenco Jose M and Lourenco Maria E
Current Estimated Value
Purchase Details
Closed on
Nov 10, 2006
Sold by
Lourenco Eduarda and Lourenco Jose M
Bought by
Lourenco Ft
Create a Home Valuation Report for This Property
The Home Valuation Report is an in-depth analysis detailing your home's value as well as a comparison with similar homes in the area
Home Values in the Area
Average Home Value in this Area
Purchase History
| Date | Buyer | Sale Price | Title Company |
|---|---|---|---|
| Lourenco Jose M | -- | None Available | |
| Lourenco Ft | -- | -- |
Source: Public Records
Tax History Compared to Growth
Tax History
| Year | Tax Paid | Tax Assessment Tax Assessment Total Assessment is a certain percentage of the fair market value that is determined by local assessors to be the total taxable value of land and additions on the property. | Land | Improvement |
|---|---|---|---|---|
| 2025 | $6,444 | $562,800 | $126,300 | $436,500 |
| 2024 | $6,171 | $537,100 | $121,500 | $415,600 |
| 2023 | $5,493 | $447,700 | $104,200 | $343,500 |
| 2022 | $4,857 | $384,900 | $94,700 | $290,200 |
| 2021 | $4,587 | $331,700 | $87,600 | $244,100 |
| 2020 | $4,112 | $284,600 | $83,800 | $200,800 |
| 2019 | $3,528 | $242,000 | $79,900 | $162,100 |
| 2018 | $2,990 | $204,500 | $78,400 | $126,100 |
| 2017 | $2,885 | $206,100 | $80,000 | $126,100 |
| 2016 | $2,816 | $206,600 | $83,300 | $123,300 |
| 2015 | $2,662 | $203,500 | $80,200 | $123,300 |
| 2014 | $2,745 | $218,200 | $84,400 | $133,800 |
Source: Public Records
Map
Nearby Homes
- 339 Danforth St Unit 6
- 337 Danforth St Unit 7
- 750 Davol St Unit 1012
- 750 Davol St Unit 119
- 750 Davol St Unit 324
- 195 Barnaby St
- 450 Rock St Unit 1
- 450 Rock St Unit 2
- 11 Dyer St
- 771 Rock St
- 206 Durfee St Unit 4B
- 206 Durfee St Unit 1A
- 206 Durfee St Unit 2B
- 206 Durfee St Unit 2A
- 206 Durfee St Unit 4A
- 206 Durfee St Unit 1B
- 72 Belmont St
- 34 Danforth St
- 364 High St
- 362 High St