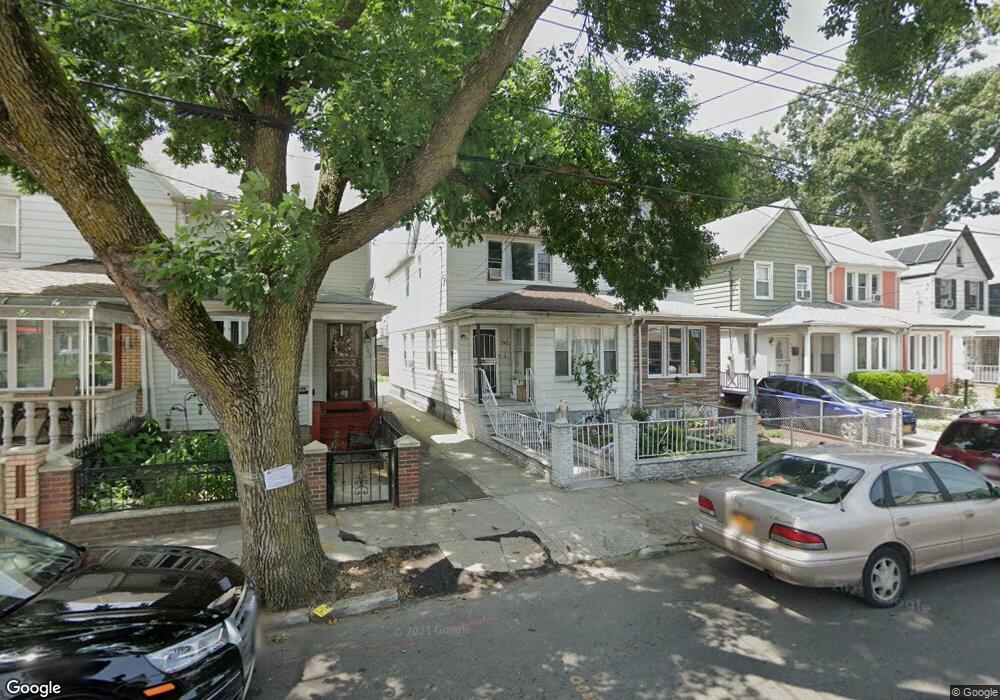
590 E 43rd St Brooklyn, NY 11203
East Flatbush NeighborhoodEstimated Value: $602,000 - $743,000
Studio
--
Bath
1,372
Sq Ft
$488/Sq Ft
Est. Value
About This Home
This home is located at 590 E 43rd St, Brooklyn, NY 11203 and is currently estimated at $669,534, approximately $487 per square foot. 590 E 43rd St is a home located in Kings County with nearby schools including P.S. 109, Andries Hudde School, and Ebenezer Preparatory School.
Ownership History
Date
Name
Owned For
Owner Type
Purchase Details
Closed on
Oct 26, 2023
Sold by
Ramsaran Pearlie
Bought by
Narine Jacqueline and Ramsaran Pearlie
Current Estimated Value
Purchase Details
Closed on
Aug 13, 2002
Sold by
Sugar Equities
Bought by
Ramsaran Pearlie
Home Financials for this Owner
Home Financials are based on the most recent Mortgage that was taken out on this home.
Original Mortgage
$212,000
Interest Rate
6.27%
Mortgage Type
Purchase Money Mortgage
Purchase Details
Closed on
May 10, 2002
Sold by
Countrywide Home Loans I
Bought by
Sugar Equities Inc
Purchase Details
Closed on
Feb 25, 1999
Sold by
Johnson Carmen
Bought by
Myton Maria
Purchase Details
Closed on
Jan 31, 1995
Sold by
Elite Homeowners Corp
Bought by
Johnson Carmen
Home Financials for this Owner
Home Financials are based on the most recent Mortgage that was taken out on this home.
Original Mortgage
$158,692
Interest Rate
9.18%
Mortgage Type
FHA
Purchase Details
Closed on
Jan 30, 1995
Sold by
Federal Home Loan Mortgage Corporation
Bought by
Elite Home Owners Corp
Home Financials for this Owner
Home Financials are based on the most recent Mortgage that was taken out on this home.
Original Mortgage
$158,692
Interest Rate
9.18%
Mortgage Type
FHA
Purchase Details
Closed on
Aug 27, 1986
Sold by
Wilson Hazel/By Atty and Wilson Packyen
Bought by
Roberson M Maxine M and Roberson Ronald
Create a Home Valuation Report for This Property
The Home Valuation Report is an in-depth analysis detailing your home's value as well as a comparison with similar homes in the area
Home Values in the Area
Average Home Value in this Area
Purchase History
| Date | Buyer | Sale Price | Title Company |
|---|---|---|---|
| Narine Jacqueline | -- | -- | |
| Narine Jacqueline | -- | -- | |
| Ramsaran Pearlie | -- | -- | |
| Ramsaran Pearlie | -- | -- | |
| Sugar Equities Inc | -- | -- | |
| Sugar Equities Inc | -- | -- | |
| Myton Maria | -- | -- | |
| Myton Maria | -- | -- | |
| Johnson Carmen | $160,000 | First American Title Ins Co | |
| Johnson Carmen | $160,000 | First American Title Ins Co | |
| Elite Home Owners Corp | $100,000 | -- | |
| Elite Home Owners Corp | $100,000 | -- | |
| Roberson M Maxine M | -- | -- | |
| Roberson M Maxine M | -- | -- |
Source: Public Records
Mortgage History
| Date | Status | Borrower | Loan Amount |
|---|---|---|---|
| Previous Owner | Ramsaran Pearlie | $212,000 | |
| Previous Owner | Johnson Carmen | $158,692 |
Source: Public Records
Tax History
| Year | Tax Paid | Tax Assessment Tax Assessment Total Assessment is a certain percentage of the fair market value that is determined by local assessors to be the total taxable value of land and additions on the property. | Land | Improvement |
|---|---|---|---|---|
| 2025 | $5,856 | $38,820 | $12,900 | $25,920 |
| 2024 | $5,856 | $39,780 | $12,900 | $26,880 |
| 2023 | $5,587 | $44,220 | $12,900 | $31,320 |
| 2022 | $5,196 | $36,180 | $12,900 | $23,280 |
| 2021 | $5,415 | $37,860 | $12,900 | $24,960 |
| 2019 | $5,083 | $32,280 | $12,900 | $19,380 |
| 2018 | $4,673 | $22,924 | $10,880 | $12,044 |
| 2017 | $4,659 | $22,856 | $10,433 | $12,423 |
| 2016 | $4,311 | $21,565 | $11,591 | $9,974 |
| 2015 | $2,601 | $21,462 | $12,986 | $8,476 |
| 2014 | $2,601 | $20,248 | $12,314 | $7,934 |
Source: Public Records
Map
Nearby Homes
- 1294 Troy Ave
- 1246 Troy Ave
- 4122 Avenue D
- 1245 Troy Ave
- 627 E 42nd St
- 1359 Albany Ave
- 1352 Troy Ave
- 4515 Foster Ave
- 1390 Troy Ave
- 4623 Avenue D
- 4404 Clarendon Rd
- 655 E 39th St
- 3906 Avenue D
- 515 E 40th St
- 1214 Schenectady Ave
- 530 E 40th St
- 708 E 39th St Unit 2
- 758 E 48th St
- 811 E 48th St
- 592 E 39th St
Your Personal Tour Guide
Ask me questions while you tour the home.