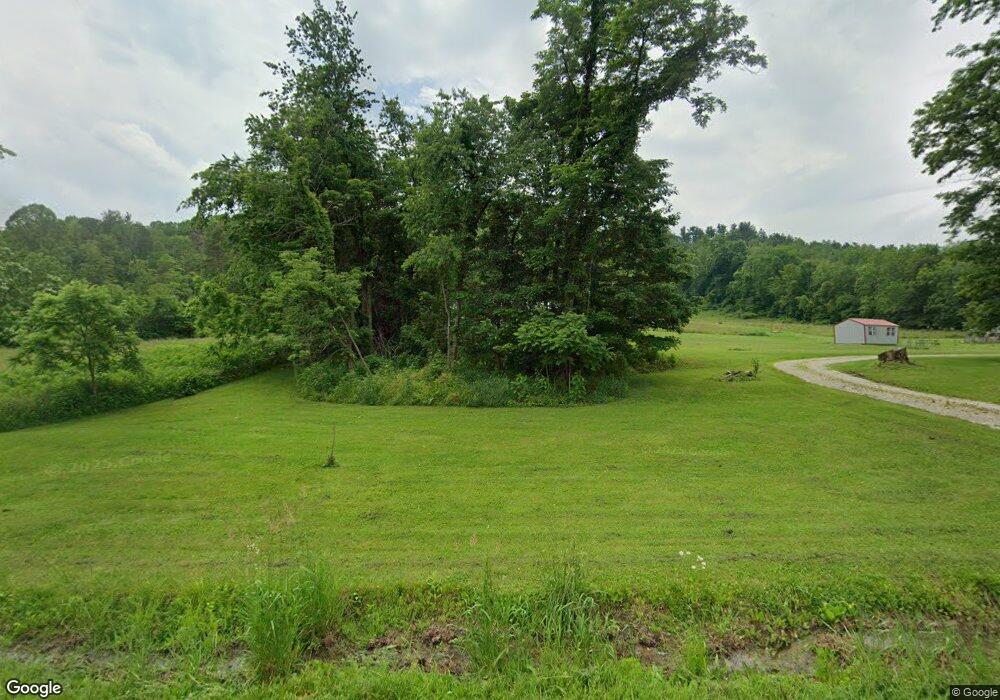
590 Frys Valley Rd SW New Philadelphia, OH 44663
Estimated Value: $109,621 - $178,000
2
Beds
1
Bath
1,512
Sq Ft
$95/Sq Ft
Est. Value
About This Home
This home is located at 590 Frys Valley Rd SW, New Philadelphia, OH 44663 and is currently estimated at $143,811, approximately $95 per square foot. 590 Frys Valley Rd SW is a home located in Tuscarawas County with nearby schools including Port Washington Elementary School, Tuscarawas Middle School, and Indian Valley High School.
Ownership History
Date
Name
Owned For
Owner Type
Purchase Details
Closed on
Jun 26, 2013
Sold by
Liggett Nadine C and Liggett Brian A
Bought by
Howell Larry R
Current Estimated Value
Purchase Details
Closed on
Jan 8, 2007
Sold by
Hickenbottom Janet
Bought by
Liggett Brian A and Liggett Nadine C
Purchase Details
Closed on
May 20, 1997
Sold by
Kaiser Hazel
Bought by
Hickenbottom Janet
Home Financials for this Owner
Home Financials are based on the most recent Mortgage that was taken out on this home.
Original Mortgage
$30,000
Interest Rate
8.27%
Mortgage Type
New Conventional
Purchase Details
Closed on
Jun 18, 1991
Sold by
Kaiser Hazel
Bought by
Kaiser Hazel
Purchase Details
Closed on
Aug 6, 1990
Sold by
Kaiser Clarence L and Kaiser Hazel M
Bought by
Kaiser Hazel
Purchase Details
Closed on
May 12, 1989
Sold by
Kaiser Clarence L and Kaiser Hazel
Bought by
Kaiser Clarence L and Kaiser Hazel M
Create a Home Valuation Report for This Property
The Home Valuation Report is an in-depth analysis detailing your home's value as well as a comparison with similar homes in the area
Home Values in the Area
Average Home Value in this Area
Purchase History
| Date | Buyer | Sale Price | Title Company |
|---|---|---|---|
| Howell Larry R | -- | Alban Title | |
| Liggett Brian A | $35,700 | Attorney | |
| Hickenbottom Janet | $40,000 | -- | |
| Kaiser Hazel | -- | -- | |
| Kaiser Hazel | -- | -- | |
| Kaiser Clarence L | -- | -- |
Source: Public Records
Mortgage History
| Date | Status | Borrower | Loan Amount |
|---|---|---|---|
| Previous Owner | Hickenbottom Janet | $30,000 |
Source: Public Records
Tax History Compared to Growth
Tax History
| Year | Tax Paid | Tax Assessment Tax Assessment Total Assessment is a certain percentage of the fair market value that is determined by local assessors to be the total taxable value of land and additions on the property. | Land | Improvement |
|---|---|---|---|---|
| 2024 | $1,295 | $35,890 | $20,570 | $15,320 |
| 2023 | $1,295 | $102,530 | $58,760 | $43,770 |
| 2022 | $1,304 | $35,890 | $20,570 | $15,320 |
| 2021 | $1,213 | $31,361 | $20,892 | $10,469 |
| 2020 | $1,226 | $31,361 | $20,892 | $10,469 |
| 2019 | $1,235 | $31,361 | $20,892 | $10,469 |
| 2018 | $1,238 | $29,980 | $19,970 | $10,010 |
| 2017 | $1,282 | $29,980 | $19,970 | $10,010 |
| 2016 | $1,168 | $29,980 | $19,970 | $10,010 |
| 2014 | $930 | $23,490 | $10,980 | $12,510 |
| 2013 | $955 | $23,490 | $10,980 | $12,510 |
Source: Public Records
Map
Nearby Homes
- 1188 Frys Valley Rd SW
- 482 Lock Seventeen Rd SE
- 1394 Sharon Valley Rd SW
- 236 N Plum St
- 5223 Kinsey Valley Rd SW
- 9375 Ridge Rd SE
- 611 Wainwright Rd SE
- 133 S Main St
- 3469 Oldtown Valley Rd SW
- 0000 Wainwright Rd
- 207 S Saint Clairsville Rd
- 4081 Schumacher Hollow Rd SE
- 4095 Schumacher Hollow Rd SE
- 592 School St
- 6518 Stonecreek Rd SW
- 5043 Frys Valley Rd SW
- 1824 Oldtown Valley Rd SE
- 6599 Buckhorn Rd
- 6176 Scott Rd SW
- 241 Packer St
- 0 Paradise Lake Rd Unit 3859639
- 7337 Paradise Lake Rd SW
- 7385 Paradise Lake Rd SW
- 7143 Paradise Lake Rd SW
- 124 Frys Valley Rd SE
- 748 Frys Valley Rd SW
- 832 Frys Valley Rd SW
- 167 Frys Valley Rd SE
- 6957 Paradise Lake Rd SW
- 6890 Paradise Lake Rd SW
- 215 Frys Valley Rd SE
- 987 Frys Valley Rd SW
- 6822 Paradise Lake Rd SW
- 6378 Fox Valley Rd SE
- 412 Frys Valley Rd SE
- 7197 Kinsey Valley Rd SW
- 6639 Paradise Lake Rd SW
- 6948 Fox Valley Rd SE
- 1260 Frys Valley Rd SW
- 1312 Frys Valley Rd SW