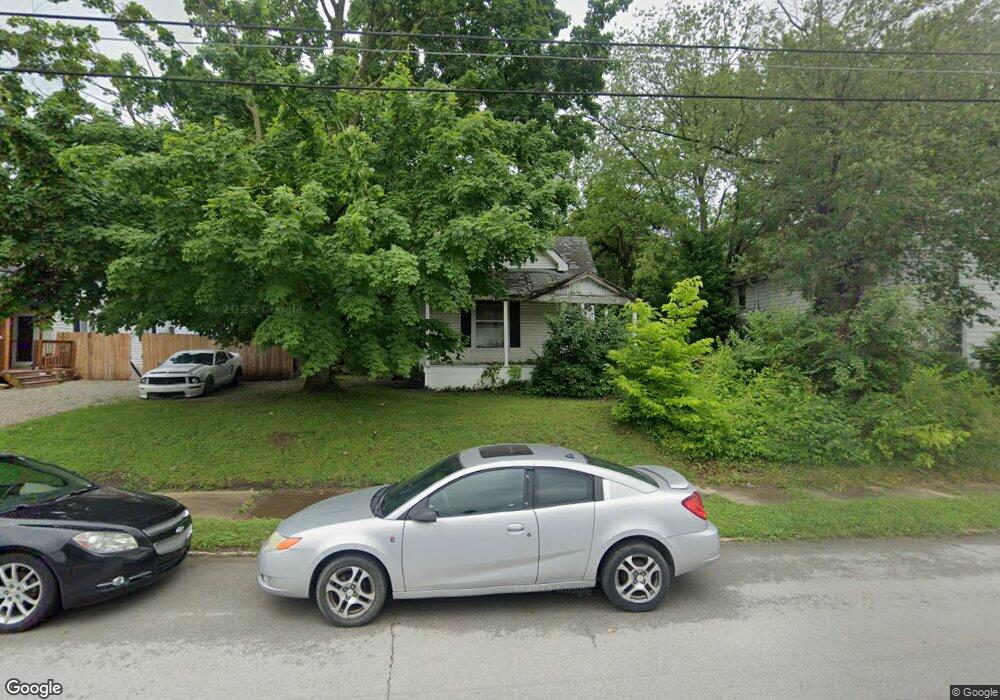
590 N 12th St New Castle, IN 47362
Estimated Value: $74,413 - $133,000
3
Beds
1
Bath
1,280
Sq Ft
$81/Sq Ft
Est. Value
About This Home
This home is located at 590 N 12th St, New Castle, IN 47362 and is currently estimated at $103,853, approximately $81 per square foot. 590 N 12th St is a home located in Henry County with nearby schools including Agape Learning Center.
Ownership History
Date
Name
Owned For
Owner Type
Purchase Details
Closed on
Jan 10, 2023
Sold by
Auditor Debra G Walker
Bought by
Stonecipher Kimberly
Current Estimated Value
Purchase Details
Closed on
Apr 3, 2007
Sold by
Lysek Linda D
Bought by
Mcintyre Brenda L and Lysek Debbra
Purchase Details
Closed on
May 9, 2005
Sold by
Deutsche Bank National Trust Co
Bought by
Lysek Linda
Purchase Details
Closed on
Feb 10, 2005
Sold by
Cooney Scott A and Cooney Lisa M
Bought by
Deutsche Bank National Trust Co
Create a Home Valuation Report for This Property
The Home Valuation Report is an in-depth analysis detailing your home's value as well as a comparison with similar homes in the area
Home Values in the Area
Average Home Value in this Area
Purchase History
| Date | Buyer | Sale Price | Title Company |
|---|---|---|---|
| Stonecipher Kimberly | $711 | Henry County Auditors Office | |
| Mcintyre Brenda L | -- | None Available | |
| Lysek Linda | -- | Security Title Services Llc | |
| Deutsche Bank National Trust Co | $50,245 | None Available |
Source: Public Records
Tax History Compared to Growth
Tax History
| Year | Tax Paid | Tax Assessment Tax Assessment Total Assessment is a certain percentage of the fair market value that is determined by local assessors to be the total taxable value of land and additions on the property. | Land | Improvement |
|---|---|---|---|---|
| 2024 | $502 | $25,100 | $18,100 | $7,000 |
| 2023 | $496 | $24,800 | $18,100 | $6,700 |
| 2022 | $346 | $17,300 | $12,100 | $5,200 |
| 2021 | $338 | $16,900 | $12,100 | $4,800 |
| 2020 | $7,292 | $16,900 | $12,100 | $4,800 |
| 2019 | $6,142 | $16,800 | $12,100 | $4,700 |
| 2018 | $5,093 | $16,700 | $12,100 | $4,600 |
| 2017 | $4,144 | $16,500 | $12,100 | $4,400 |
| 2016 | $3,302 | $17,400 | $12,700 | $4,700 |
| 2014 | $879 | $43,800 | $12,700 | $31,100 |
| 2013 | $879 | $42,200 | $12,700 | $29,500 |
Source: Public Records
Map
Nearby Homes
- 595 N Main St
- 711 N 14th St
- 1321 Woodward Ave
- 1293 Garner St
- 1522 Michigan St
- 1324 Thornburg St
- Enslow Plan at The Preserve at Northfield Village
- Buchanan Plan at The Preserve at Northfield Village
- Mckinley Plan at The Preserve at Northfield Village
- Eisenhower Plan at The Preserve at Northfield Village
- Cleveland Plan at The Preserve at Northfield Village
- Windsor Plan at The Preserve at Northfield Village
- Wellingston Plan at The Preserve at Northfield Village
- Sunderland Plan at The Preserve at Northfield Village
- Stirling Plan at The Preserve at Northfield Village
- Preston Plan at The Preserve at Northfield Village
- Oxford Plan at The Preserve at Northfield Village
- Newport Plan at The Preserve at Northfield Village
- Kingston Plan at The Preserve at Northfield Village
- Kent Plan at The Preserve at Northfield Village