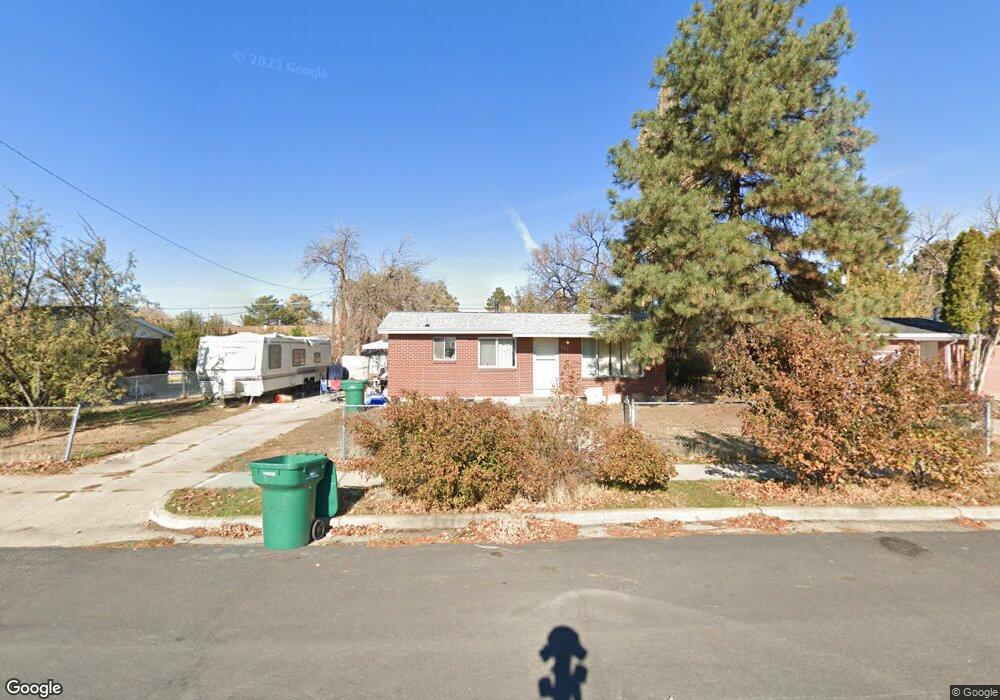
590 Paul Ave Layton, UT 84041
Estimated Value: $365,000 - $412,641
3
Beds
2
Baths
1,980
Sq Ft
$195/Sq Ft
Est. Value
About This Home
This home is located at 590 Paul Ave, Layton, UT 84041 and is currently estimated at $386,160, approximately $195 per square foot. 590 Paul Ave is a home located in Davis County with nearby schools including Lincoln Elementary School, North Layton Junior High School, and Northridge High School.
Ownership History
Date
Name
Owned For
Owner Type
Purchase Details
Closed on
Jul 7, 2020
Sold by
T K Krause Hoa and Krause Jerold D
Bought by
Krause Hoa Thi
Current Estimated Value
Home Financials for this Owner
Home Financials are based on the most recent Mortgage that was taken out on this home.
Original Mortgage
$71,600
Interest Rate
3.1%
Mortgage Type
New Conventional
Purchase Details
Closed on
Nov 14, 2003
Sold by
Knobel Hoa T and Krause Jerold D
Bought by
Krause Jerold D and Krause Hoa T K
Purchase Details
Closed on
Nov 15, 2001
Sold by
Knobel Hoathi
Bought by
Knobel Hoa T and Krause Jerold D
Home Financials for this Owner
Home Financials are based on the most recent Mortgage that was taken out on this home.
Original Mortgage
$98,400
Interest Rate
6.62%
Purchase Details
Closed on
Sep 27, 1999
Sold by
Knobel Elwood L and Knobel Hoathi
Bought by
Knobel Hoathi
Create a Home Valuation Report for This Property
The Home Valuation Report is an in-depth analysis detailing your home's value as well as a comparison with similar homes in the area
Home Values in the Area
Average Home Value in this Area
Purchase History
| Date | Buyer | Sale Price | Title Company |
|---|---|---|---|
| Krause Hoa Thi | -- | First American Title | |
| Krause Jerold D | -- | -- | |
| Knobel Hoa T | -- | Bonneville Title Company Inc | |
| Knobel Hoathi | -- | Us Title |
Source: Public Records
Mortgage History
| Date | Status | Borrower | Loan Amount |
|---|---|---|---|
| Closed | Krause Hoa Thi | $71,600 | |
| Closed | Knobel Hoa T | $98,400 |
Source: Public Records
Tax History Compared to Growth
Tax History
| Year | Tax Paid | Tax Assessment Tax Assessment Total Assessment is a certain percentage of the fair market value that is determined by local assessors to be the total taxable value of land and additions on the property. | Land | Improvement |
|---|---|---|---|---|
| 2025 | $1,818 | $190,850 | $103,254 | $87,596 |
| 2024 | $1,774 | $187,549 | $120,237 | $67,312 |
| 2023 | $1,717 | $176,000 | $78,238 | $97,761 |
| 2022 | $1,723 | $317,000 | $137,123 | $179,877 |
| 2021 | $1,603 | $242,000 | $106,338 | $135,662 |
| 2020 | $1,464 | $212,000 | $89,245 | $122,755 |
| 2019 | $1,481 | $210,000 | $84,552 | $125,448 |
| 2018 | $1,306 | $186,000 | $84,552 | $101,448 |
| 2016 | $1,144 | $84,040 | $27,162 | $56,878 |
| 2015 | $1,077 | $75,130 | $27,162 | $47,968 |
| 2014 | $1,000 | $71,295 | $27,162 | $44,133 |
| 2013 | -- | $76,159 | $24,816 | $51,343 |
Source: Public Records
Map
Nearby Homes
- 1715 N Alder St
- 398 Paul Ave
- 538 W 1875 N
- 1683 N 250 W
- 1908 N 200 W
- 2149 N 750 W
- 1490 N 175 W
- 2211 N 525 W
- 506 W 2200 N
- 2233 N 475 W
- 1500 N Angel St Unit 12
- 1500 N Angel St Unit 22
- 2248 N 500 W
- 2053 Evans Cove Loop Unit 39
- 1583 N 25 E
- 2048 Evans Cove Loop
- 1094 N Angel St W
- 1036 N Angel St W
- 1615 N Angel St W
- 1615 N Angel St Unit F