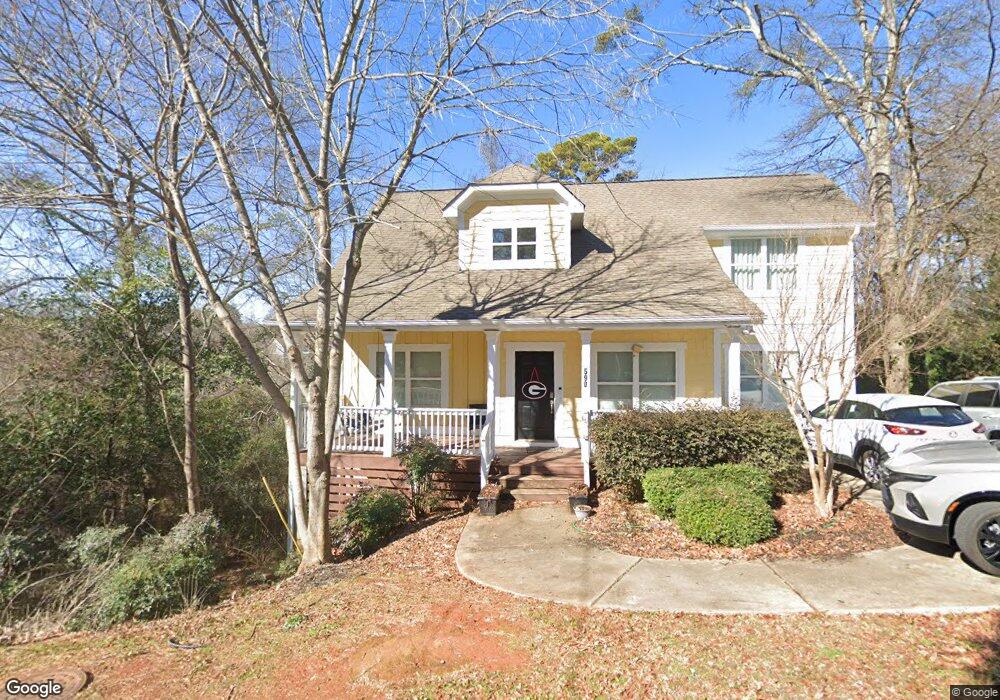
590 S Poplar St Athens, GA 30601
Carrs Hill NeighborhoodEstimated Value: $596,000 - $731,000
--
Bed
6
Baths
2,087
Sq Ft
$326/Sq Ft
Est. Value
About This Home
This home is located at 590 S Poplar St, Athens, GA 30601 and is currently estimated at $679,875, approximately $325 per square foot. 590 S Poplar St is a home located in Clarke County with nearby schools including Gaines Elementary School, Hilsman Middle School, and Cedar Shoals High School.
Ownership History
Date
Name
Owned For
Owner Type
Purchase Details
Closed on
Dec 14, 2020
Sold by
Broadlands Investments Llc
Bought by
Poplar Endeavors Three Llc
Current Estimated Value
Purchase Details
Closed on
Nov 16, 2020
Sold by
Rcwsj Llc
Bought by
Broadlands Investments Llc
Purchase Details
Closed on
Aug 20, 2018
Sold by
Skb Investments Llc
Bought by
Rcwsj Llc
Purchase Details
Closed on
Jul 7, 2012
Sold by
Peterson Ray
Bought by
Skb Investments Llc
Purchase Details
Closed on
Jul 28, 2006
Sold by
Not Provided
Bought by
Peterson Ray P
Purchase Details
Closed on
Mar 24, 2006
Sold by
Not Provided
Bought by
Peterson Ray P
Home Financials for this Owner
Home Financials are based on the most recent Mortgage that was taken out on this home.
Original Mortgage
$147,750
Interest Rate
6.23%
Mortgage Type
New Conventional
Create a Home Valuation Report for This Property
The Home Valuation Report is an in-depth analysis detailing your home's value as well as a comparison with similar homes in the area
Home Values in the Area
Average Home Value in this Area
Purchase History
| Date | Buyer | Sale Price | Title Company |
|---|---|---|---|
| Poplar Endeavors Three Llc | -- | -- | |
| Broadlands Investments Llc | $1,535,000 | -- | |
| Rcwsj Llc | $1,100,000 | -- | |
| Skb Investments Llc | $600,000 | -- | |
| Peterson Ray P | $219,366 | -- | |
| Peterson Ray P | $60,000 | -- |
Source: Public Records
Mortgage History
| Date | Status | Borrower | Loan Amount |
|---|---|---|---|
| Previous Owner | Peterson Ray P | $147,750 |
Source: Public Records
Tax History Compared to Growth
Tax History
| Year | Tax Paid | Tax Assessment Tax Assessment Total Assessment is a certain percentage of the fair market value that is determined by local assessors to be the total taxable value of land and additions on the property. | Land | Improvement |
|---|---|---|---|---|
| 2025 | $8,164 | $262,944 | $22,000 | $240,944 |
| 2024 | $8,164 | $291,039 | $22,000 | $269,039 |
| 2023 | $9,095 | $266,311 | $16,000 | $250,311 |
| 2022 | $7,841 | $245,801 | $14,000 | $231,801 |
| 2021 | $6,850 | $203,264 | $12,000 | $191,264 |
| 2020 | $4,674 | $138,696 | $12,000 | $126,696 |
| 2019 | $4,458 | $131,299 | $12,000 | $119,299 |
| 2018 | $3,257 | $95,942 | $12,000 | $83,942 |
| 2017 | $3,065 | $90,282 | $12,000 | $78,282 |
| 2016 | $3,007 | $88,573 | $12,000 | $76,573 |
| 2015 | $2,759 | $81,158 | $12,000 | $69,158 |
| 2014 | $2,617 | $76,863 | $12,000 | $64,863 |
Source: Public Records
Map
Nearby Homes
- 250 Little St Unit A105
- 250 Little St Unit A209
- 250 Little St Unit A 105
- 250 Little St Unit D205
- 250 Little St Unit D205
- 225 Oak St Unit LOT 103
- 225 Oak St Unit 104
- 225 Oak St Unit 108
- 357 S Peter St
- 210 Appleby Dr Unit 225
- 210 Appleby Dr Unit 208
- 210 Appleby Dr Unit 211
- 290 Appleby Dr Unit 268
- 126 S Poplar St
- 1480 E Broad St
- 132 N Poplar St
- 704 Branch St
- 580 S Poplar St
- 570 S Poplar St
- 129 Little St
- 545 S Poplar St
- 560 S Poplar St
- 525 S Poplar St
- 194 Little St
- 194 Little St
- 732 Little Oconee St
- 195 Little St
- 194 & 202 Little
- 197 Little St
- 198 Little St
- 198 Little St Unit A
- 198 Little St Unit B
- 198 Little St Unit A & B
- 742 Little Oconee St
- 782 Little Oconee St
- 202 Little St
- 792 Little Oconee St