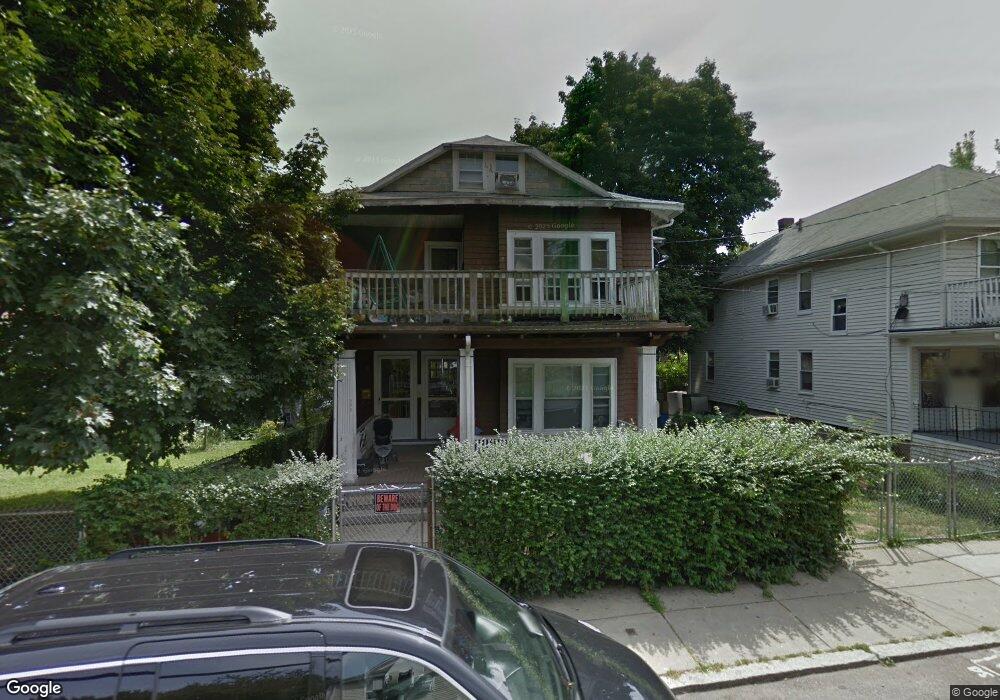
590 South St Roslindale, MA 02131
Roslindale NeighborhoodEstimated Value: $813,000 - $1,025,642
6
Beds
2
Baths
2,444
Sq Ft
$378/Sq Ft
Est. Value
About This Home
This home is located at 590 South St, Roslindale, MA 02131 and is currently estimated at $922,911, approximately $377 per square foot. 590 South St is a home located in Suffolk County with nearby schools including Brooke Charter School Roslindale, The Croft School - Jamaica Plain, and St. Clare High School.
Ownership History
Date
Name
Owned For
Owner Type
Purchase Details
Closed on
Jan 28, 2024
Sold by
Daou Fadi H
Bought by
590 South St Nt and Daou
Current Estimated Value
Purchase Details
Closed on
Jul 27, 1988
Sold by
Mcnamara Dennis J
Bought by
Daou Fadi H
Home Financials for this Owner
Home Financials are based on the most recent Mortgage that was taken out on this home.
Original Mortgage
$144,000
Interest Rate
10.39%
Mortgage Type
Purchase Money Mortgage
Create a Home Valuation Report for This Property
The Home Valuation Report is an in-depth analysis detailing your home's value as well as a comparison with similar homes in the area
Home Values in the Area
Average Home Value in this Area
Purchase History
| Date | Buyer | Sale Price | Title Company |
|---|---|---|---|
| 590 South St Nt | -- | None Available | |
| Daou Fadi H | $160,000 | -- |
Source: Public Records
Mortgage History
| Date | Status | Borrower | Loan Amount |
|---|---|---|---|
| Previous Owner | Daou Fadi H | $144,000 |
Source: Public Records
Tax History Compared to Growth
Tax History
| Year | Tax Paid | Tax Assessment Tax Assessment Total Assessment is a certain percentage of the fair market value that is determined by local assessors to be the total taxable value of land and additions on the property. | Land | Improvement |
|---|---|---|---|---|
| 2025 | $8,599 | $742,600 | $247,900 | $494,700 |
| 2024 | $7,802 | $715,800 | $222,700 | $493,100 |
| 2023 | $7,323 | $681,800 | $212,100 | $469,700 |
| 2022 | $6,934 | $637,300 | $198,300 | $439,000 |
| 2021 | $6,602 | $618,700 | $192,500 | $426,200 |
| 2020 | $5,647 | $534,800 | $179,900 | $354,900 |
| 2019 | $5,270 | $500,000 | $142,800 | $357,200 |
| 2018 | $4,764 | $454,600 | $142,800 | $311,800 |
| 2017 | $4,764 | $449,900 | $142,800 | $307,100 |
| 2016 | $4,668 | $424,400 | $142,800 | $281,600 |
| 2015 | $4,658 | $384,600 | $107,800 | $276,800 |
| 2014 | $4,193 | $333,300 | $107,800 | $225,500 |
Source: Public Records
Map
Nearby Homes
- 4031 Washington St
- 4012 Washington St
- 620 South St
- 19 Delford St
- 19 Delford St Unit 1
- 173 Brookway Rd
- 18-20 Northbourne Rd Unit 18
- 158 Wachusett St Unit 3
- 348-350 Hyde Park Ave Unit 2
- 178 Hyde Park Ave Unit 3
- 2 Weld Hill St Unit PH2
- 143-171 Hyde Park Ave Unit 169A
- 187 Florence St Unit 2L
- 140 Wachusett St
- 50 Southbourne Rd
- 31 Rodman St Unit 2
- 31 Rodman St Unit 1
- 108 Florence St Unit 3
- 108 Florence St Unit 1
- 108 Florence St Unit 4
- 594 South St
- 594 South St
- 594 South St Unit 1
- 582 South St
- 19 Mosgrove Ave
- 14 Lesher St Unit 16
- 14 Lesher St Unit 2
- 10 Lesher St Unit 12
- 581 South St
- 581 South St Unit 2
- 581 South St Unit 1
- 12 Lesher St Unit 1
- 583 South St Unit 585
- 600 South St
- 15 Mosgrove Ave
- 595 South St
- 599 South St Unit 2
- 599 South St Unit 1
- 577 South St
- 8 Lesher St