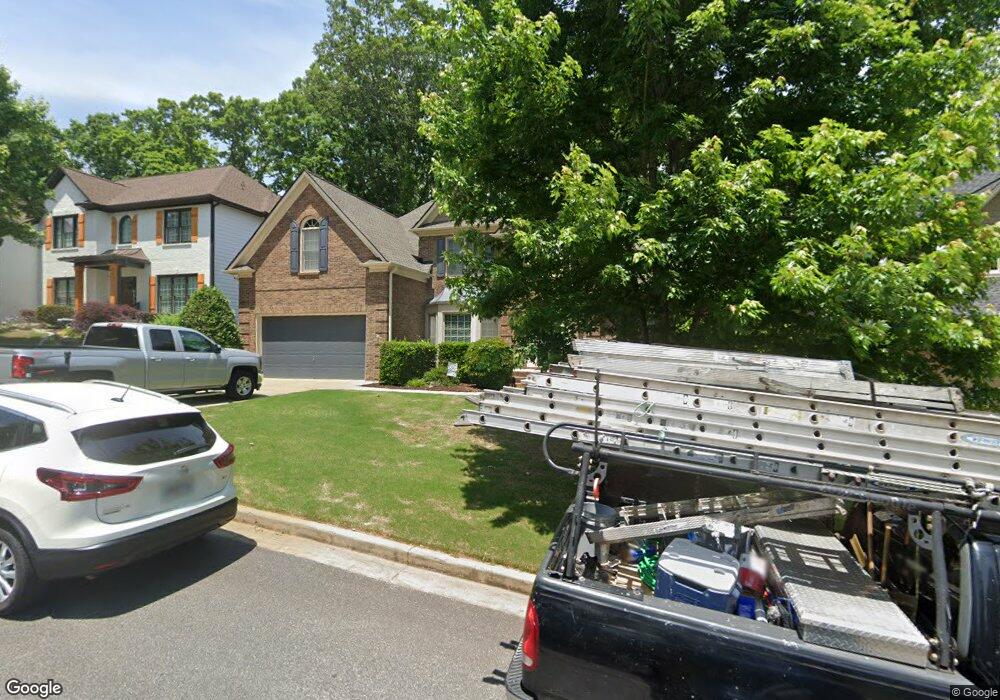
590 Washington Way Cumming, GA 30040
Estimated Value: $678,934 - $716,000
5
Beds
6
Baths
4,066
Sq Ft
$172/Sq Ft
Est. Value
About This Home
This home is located at 590 Washington Way, Cumming, GA 30040 and is currently estimated at $700,734, approximately $172 per square foot. 590 Washington Way is a home located in Forsyth County with nearby schools including George W. Whitlow Elementary School, Otwell Middle School, and Forsyth Central High School.
Ownership History
Date
Name
Owned For
Owner Type
Purchase Details
Closed on
Nov 6, 2009
Sold by
Mesa Sally J
Bought by
Cheoun Sook J and Cheoun Jung S
Current Estimated Value
Home Financials for this Owner
Home Financials are based on the most recent Mortgage that was taken out on this home.
Original Mortgage
$249,200
Outstanding Balance
$162,801
Interest Rate
5.01%
Mortgage Type
New Conventional
Estimated Equity
$537,933
Purchase Details
Closed on
May 25, 2006
Sold by
Peachtree Residential Props In
Bought by
Mesa Sally J
Home Financials for this Owner
Home Financials are based on the most recent Mortgage that was taken out on this home.
Original Mortgage
$150,000
Interest Rate
6.41%
Mortgage Type
New Conventional
Purchase Details
Closed on
Jan 9, 2006
Sold by
Freedom Creek Partners
Bought by
Peachtree Residential Props In
Home Financials for this Owner
Home Financials are based on the most recent Mortgage that was taken out on this home.
Original Mortgage
$535,000
Interest Rate
6.18%
Create a Home Valuation Report for This Property
The Home Valuation Report is an in-depth analysis detailing your home's value as well as a comparison with similar homes in the area
Home Values in the Area
Average Home Value in this Area
Purchase History
| Date | Buyer | Sale Price | Title Company |
|---|---|---|---|
| Cheoun Sook J | $311,500 | -- | |
| Mesa Sally J | $379,900 | -- | |
| Peachtree Residential Props In | $140,000 | -- |
Source: Public Records
Mortgage History
| Date | Status | Borrower | Loan Amount |
|---|---|---|---|
| Open | Cheoun Sook J | $249,200 | |
| Previous Owner | Mesa Sally J | $150,000 | |
| Previous Owner | Peachtree Residential Props In | $535,000 |
Source: Public Records
Tax History Compared to Growth
Tax History
| Year | Tax Paid | Tax Assessment Tax Assessment Total Assessment is a certain percentage of the fair market value that is determined by local assessors to be the total taxable value of land and additions on the property. | Land | Improvement |
|---|---|---|---|---|
| 2025 | $1,077 | $267,560 | $66,000 | $201,560 |
| 2024 | $1,077 | $259,852 | $66,000 | $193,852 |
| 2023 | $983 | $245,940 | $62,000 | $183,940 |
| 2022 | $1,076 | $157,644 | $34,000 | $123,644 |
| 2021 | $1,026 | $157,644 | $34,000 | $123,644 |
| 2020 | $1,021 | $152,136 | $34,000 | $118,136 |
| 2019 | $1,020 | $145,108 | $28,000 | $117,108 |
| 2018 | $1,017 | $137,680 | $28,000 | $109,680 |
| 2017 | $1,032 | $138,524 | $28,000 | $110,524 |
| 2016 | $1,034 | $139,524 | $29,000 | $110,524 |
| 2015 | $1,026 | $134,284 | $29,000 | $105,284 |
| 2014 | $761 | $106,496 | $0 | $0 |
Source: Public Records
Map
Nearby Homes
- 580 Washington Way
- 700 Washington Way
- 980 Patriot Trail
- 3905 Delfaire Trace Unit I
- 1030 Firethorne Pass
- 950 Firethorne Pass
- 3680 Castleberry Rd
- 3815 Glen Laurel Ct
- 3554 Castleberry Rd
- 5314 Sherwood Way
- 3625 Maple Valley Dr Unit 4
- 4706 Piney Grove Rd
- 3760 Castleberry Rd
- 3815 Castleberry Rd
- 4914 Sherwood Way
- 3707 Delfaire Trace
- 3450 Maple Valley Dr Unit 4
- 600 Washington Way
- 600 Washington Way Unit 1
- 610 Washington Way
- 605 Jefferson Place
- 620 Washington Way
- 615 Washington Way
- 575 Washington Way
- 620 Jefferson Place
- 4580 Tovero Pass
- 560 Washington Way
- 615 Jefferson Place
- 4570 Tovero Pass
- 4590 Tovero Pass
- 565 Washington Way
- 4610 Tovero Pass
- 4560 Tovero Pass
- 630 Washington Way
- 645 Washington Way
- 4550 Tovero Pass
- 630 Jefferson Place