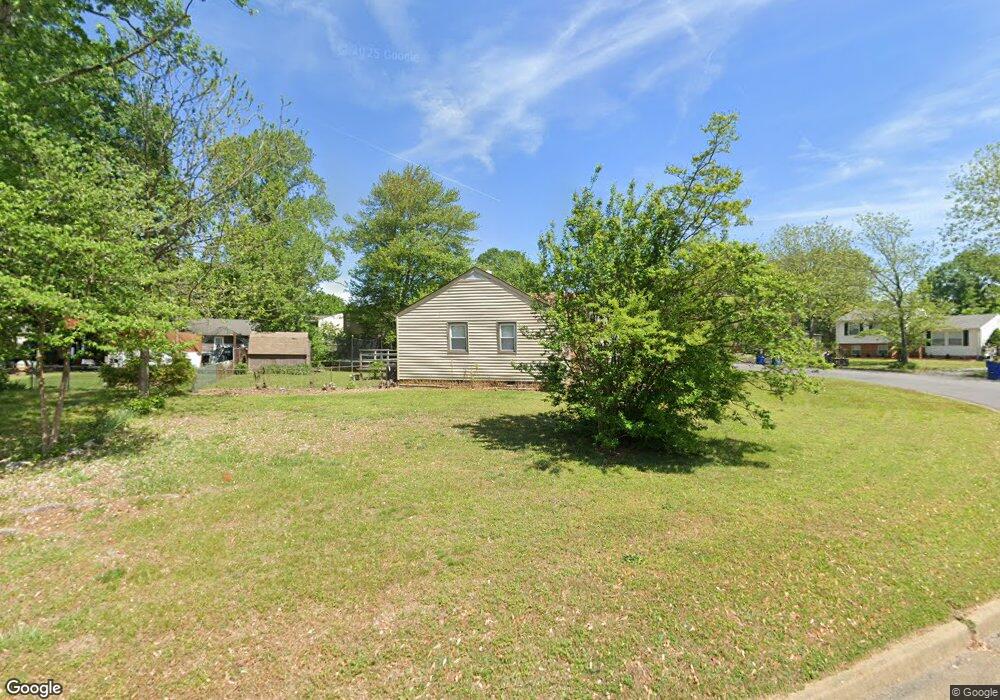
5900 Crabtree Rd North Chesterfield, VA 23234
North Chesterfield NeighborhoodEstimated Value: $246,000 - $276,733
2
Beds
2
Baths
1,152
Sq Ft
$229/Sq Ft
Est. Value
About This Home
This home is located at 5900 Crabtree Rd, North Chesterfield, VA 23234 and is currently estimated at $263,683, approximately $228 per square foot. 5900 Crabtree Rd is a home located in Chesterfield County with nearby schools including J.A. Chalkley Elementary School, Manchester Middle School, and Meadowbrook High School.
Ownership History
Date
Name
Owned For
Owner Type
Purchase Details
Closed on
Mar 22, 2005
Sold by
Warren Lindsay
Bought by
Williams Cassandra R
Current Estimated Value
Home Financials for this Owner
Home Financials are based on the most recent Mortgage that was taken out on this home.
Original Mortgage
$99,200
Outstanding Balance
$50,292
Interest Rate
5.61%
Mortgage Type
New Conventional
Estimated Equity
$213,391
Purchase Details
Closed on
Mar 8, 2002
Bought by
Lindsay Warren
Home Financials for this Owner
Home Financials are based on the most recent Mortgage that was taken out on this home.
Original Mortgage
$13,300
Interest Rate
7.01%
Mortgage Type
New Conventional
Purchase Details
Closed on
Dec 12, 2001
Sold by
Byrd Adam D
Bought by
Lindsay Warren
Purchase Details
Closed on
May 30, 1997
Sold by
Harris Elizabeth G
Bought by
Byrd Adam B
Home Financials for this Owner
Home Financials are based on the most recent Mortgage that was taken out on this home.
Original Mortgage
$68,983
Interest Rate
8.09%
Mortgage Type
FHA
Create a Home Valuation Report for This Property
The Home Valuation Report is an in-depth analysis detailing your home's value as well as a comparison with similar homes in the area
Home Values in the Area
Average Home Value in this Area
Purchase History
| Date | Buyer | Sale Price | Title Company |
|---|---|---|---|
| Williams Cassandra R | $124,000 | -- | |
| Lindsay Warren | -- | -- | |
| Lindsay Warren | $66,420 | -- | |
| Byrd Adam B | $69,500 | -- |
Source: Public Records
Mortgage History
| Date | Status | Borrower | Loan Amount |
|---|---|---|---|
| Open | Williams Cassandra R | $99,200 | |
| Previous Owner | Byrd Adam B | $13,300 | |
| Previous Owner | Byrd Adam B | $68,983 |
Source: Public Records
Tax History Compared to Growth
Tax History
| Year | Tax Paid | Tax Assessment Tax Assessment Total Assessment is a certain percentage of the fair market value that is determined by local assessors to be the total taxable value of land and additions on the property. | Land | Improvement |
|---|---|---|---|---|
| 2025 | $2,133 | $236,900 | $56,000 | $180,900 |
| 2024 | $2,133 | $218,100 | $51,000 | $167,100 |
| 2023 | $1,724 | $189,400 | $49,000 | $140,400 |
| 2022 | $1,711 | $186,000 | $46,000 | $140,000 |
| 2021 | $1,573 | $158,600 | $42,000 | $116,600 |
| 2020 | $1,396 | $146,900 | $39,000 | $107,900 |
| 2019 | $1,301 | $136,900 | $38,000 | $98,900 |
| 2018 | $1,216 | $128,000 | $35,000 | $93,000 |
| 2017 | $1,198 | $124,800 | $35,000 | $89,800 |
| 2016 | $1,175 | $122,400 | $35,000 | $87,400 |
| 2015 | $1,165 | $118,700 | $35,000 | $83,700 |
| 2014 | $1,165 | $118,700 | $35,000 | $83,700 |
Source: Public Records
Map
Nearby Homes
- 5616 Heatherhill Dr
- 4519 Stanbrook Dr
- 3900 Bridget Ct
- 5511 Belle Pond Dr
- 4340 Jalee Dr
- 3807 Belker Ct
- 3800 Grizzard Dr
- 6551 West Rd
- 6026 Partingdale Cir
- 3604 Stevens Wood Ct
- 5400 Belmont Rd
- 3104 S Battlebridge Dr
- 6900 Summers Trace Terrace
- 4003 Laughton Ct
- 6512 N Stevens Hollow Dr
- 3901 Old Creek Rd
- 7020 Summers Trace Ct
- 6912 Laughton Dr
- 4811 Hackney Rd
- 3112 Johns Way
- 5916 Crabtree Rd
- 4136 Woodfield Rd
- 5901 Crabtree Rd
- 4149 Woodfield Rd
- 4130 Woodfield Rd
- 5909 Crabtree Rd
- 4143 Woodfield Rd
- 4125 Laurelwood Rd
- 4137 Woodfield Rd
- 5905 Crabtree Rd
- 5915 Crabtree Rd
- 4131 Woodfield Rd
- 4124 Woodfield Rd
- 5921 Crabtree Rd
- 4119 Laurelwood Rd
- 4125 Woodfield Rd
- 5906 Belmont Rd
- 4200 Lamplighter Dr
- 5900 Belmont Rd
- 4208 Lamplighter Dr