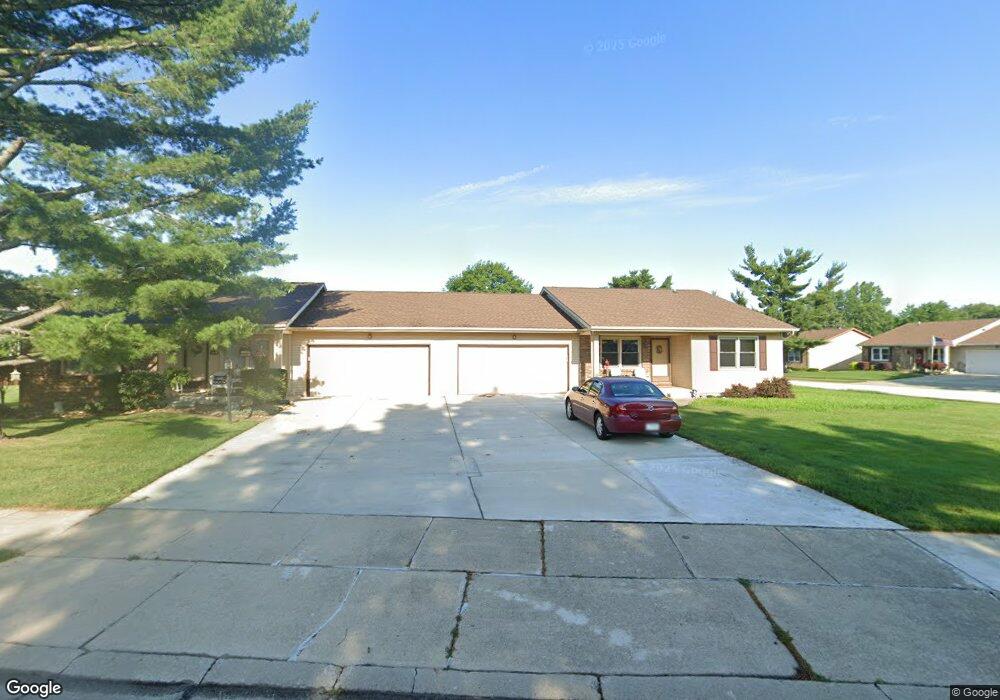
5901 Lansdown Blvd South Bend, IN 46614
Estimated Value: $287,000 - $314,000
2
Beds
3
Baths
1,924
Sq Ft
$155/Sq Ft
Est. Value
About This Home
This home is located at 5901 Lansdown Blvd, South Bend, IN 46614 and is currently estimated at $298,599, approximately $155 per square foot. 5901 Lansdown Blvd is a home located in St. Joseph County with nearby schools including Marshall Traditional School, Hay Elementary School, and Clay Intermediate Center.
Ownership History
Date
Name
Owned For
Owner Type
Purchase Details
Closed on
May 21, 2021
Sold by
Klota Susan
Bought by
Klota Susan
Current Estimated Value
Purchase Details
Closed on
Sep 1, 2016
Sold by
Harrell Carrie L
Bought by
Klota Susan
Home Financials for this Owner
Home Financials are based on the most recent Mortgage that was taken out on this home.
Original Mortgage
$55,000
Interest Rate
3.48%
Create a Home Valuation Report for This Property
The Home Valuation Report is an in-depth analysis detailing your home's value as well as a comparison with similar homes in the area
Home Values in the Area
Average Home Value in this Area
Purchase History
| Date | Buyer | Sale Price | Title Company |
|---|---|---|---|
| Klota Susan | -- | None Listed On Document | |
| Klota Susan | -- | -- |
Source: Public Records
Mortgage History
| Date | Status | Borrower | Loan Amount |
|---|---|---|---|
| Previous Owner | Klota Susan | $55,000 |
Source: Public Records
Tax History Compared to Growth
Tax History
| Year | Tax Paid | Tax Assessment Tax Assessment Total Assessment is a certain percentage of the fair market value that is determined by local assessors to be the total taxable value of land and additions on the property. | Land | Improvement |
|---|---|---|---|---|
| 2024 | $2,338 | $274,200 | $9,100 | $265,100 |
| 2023 | $2,195 | $195,500 | $9,100 | $186,400 |
| 2022 | $2,238 | $184,500 | $9,100 | $175,400 |
| 2021 | $2,060 | $170,300 | $9,100 | $161,200 |
| 2020 | $1,935 | $160,400 | $8,600 | $151,800 |
| 2019 | $1,864 | $182,100 | $8,100 | $174,000 |
| 2018 | $2,074 | $172,200 | $7,500 | $164,700 |
| 2017 | $1,815 | $146,200 | $6,300 | $139,900 |
| 2016 | $1,849 | $146,200 | $6,300 | $139,900 |
| 2014 | $1,682 | $136,000 | $6,300 | $129,700 |
Source: Public Records
Map
Nearby Homes
- 1835 Stonehedge Ln
- 5725 Aberdeen Ct
- 6020 Old English Ct
- 1927 E Farnsworth Dr
- 6235 York Rd
- 17866 Bellows Falls Dr
- 6244 Regent Ct
- 60506 Woodstock Dr
- 1411 Cambridge Dr
- 1222 Berkshire Dr
- 1839 Renfrew Dr
- 5015 Kirkshire Dr
- 5914 Miami St
- 5428 Raleigh Dr
- 5305 Monticello Ct
- 5002 Heather Ln
- 1725 Thornhill Dr
- 1719 Thornhill Dr
- 1713 Thornhill Dr
- 1515 Strathmore Ct
- 5905 Lansdown Blvd
- 1838 Stonehedge Ln
- 1839 Stonehedge Ln
- 1841 Stonehedge Ln
- 1836 Stonehedge Ln
- 1827 Somersworth Dr
- 1825 Somersworth Dr
- 1853 Stonehedge Ln
- 1847 Stonehedge Ln
- 1829 Somersworth Dr
- 5902 Lansdown Blvd
- 5908 Lansdown Blvd
- 1833 Stonehedge Ln
- 1831 Somersworth Dr
- 1830 Stonehedge Ln
- 5912 Lansdown Blvd
- 1823 Somersworth Dr
- 5916 Lansdown Blvd
- 1903 Stonehedge Ln
- 1901 Stonehedge Ln