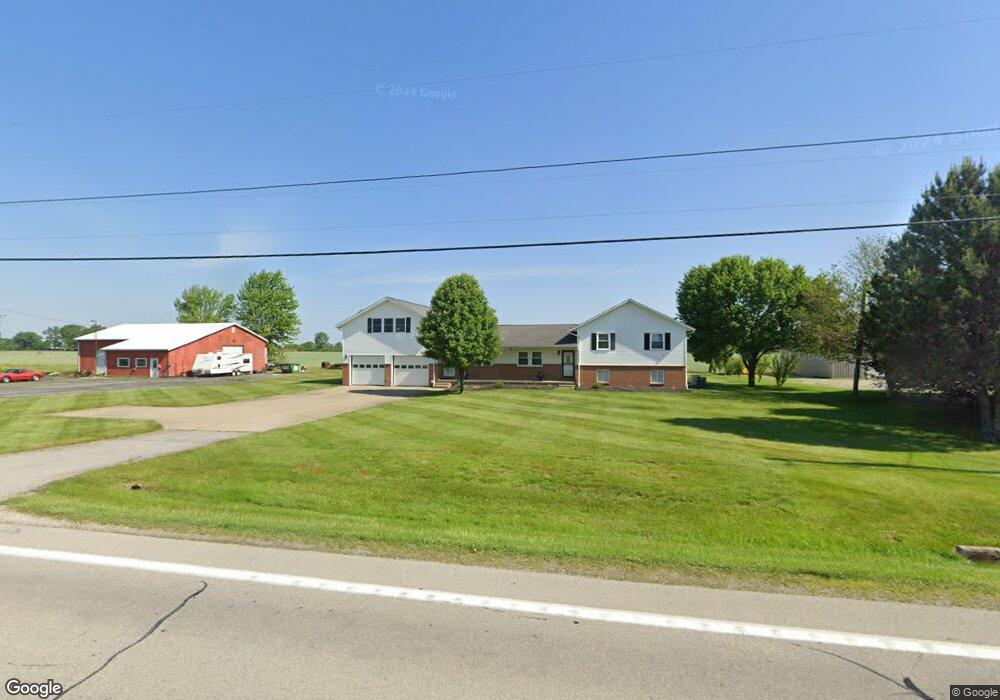
5901 West Harbor Rd Port Clinton, OH 43452
Estimated Value: $305,000 - $338,000
2
Beds
2
Baths
2,096
Sq Ft
$151/Sq Ft
Est. Value
About This Home
This home is located at 5901 West Harbor Rd, Port Clinton, OH 43452 and is currently estimated at $315,575, approximately $150 per square foot. 5901 West Harbor Rd is a home located in Ottawa County with nearby schools including Bataan Memorial Primary School, Bataan Memorial Intermediate School, and Port Clinton Middle School.
Ownership History
Date
Name
Owned For
Owner Type
Purchase Details
Closed on
Feb 10, 2021
Sold by
Collins Elisa T
Bought by
Shoemaker Andrew L and Shoemaker Sara N
Current Estimated Value
Home Financials for this Owner
Home Financials are based on the most recent Mortgage that was taken out on this home.
Original Mortgage
$160,000
Outstanding Balance
$142,854
Interest Rate
2.6%
Mortgage Type
New Conventional
Estimated Equity
$172,721
Purchase Details
Closed on
Aug 8, 2017
Sold by
Collins Elisa T
Bought by
Collins Kayla and Collins Sara
Purchase Details
Closed on
Jul 11, 2012
Sold by
Collins Dale Thomas and Collins Elisa T
Bought by
Collins Dale Thomas and Collins Elisa T
Purchase Details
Closed on
Mar 2, 1993
Sold by
Collins Dale E and Collins Wilma
Bought by
Collins Dale Thos and Collins Elisa T
Create a Home Valuation Report for This Property
The Home Valuation Report is an in-depth analysis detailing your home's value as well as a comparison with similar homes in the area
Home Values in the Area
Average Home Value in this Area
Purchase History
| Date | Buyer | Sale Price | Title Company |
|---|---|---|---|
| Shoemaker Andrew L | $200,000 | None Available | |
| Shoemaker Andrew L | -- | None Listed On Document | |
| Collins Kayla | -- | None Available | |
| Collins Dale Thomas | -- | Attorney | |
| Collins Dale Thos | -- | -- |
Source: Public Records
Mortgage History
| Date | Status | Borrower | Loan Amount |
|---|---|---|---|
| Open | Shoemaker Andrew L | $160,000 | |
| Closed | Shoemaker Andrew L | $160,000 |
Source: Public Records
Tax History Compared to Growth
Tax History
| Year | Tax Paid | Tax Assessment Tax Assessment Total Assessment is a certain percentage of the fair market value that is determined by local assessors to be the total taxable value of land and additions on the property. | Land | Improvement |
|---|---|---|---|---|
| 2024 | $2,850 | $87,091 | $8,026 | $79,065 |
| 2023 | $2,850 | $67,732 | $5,733 | $61,999 |
| 2022 | $2,274 | $62,654 | $5,733 | $56,921 |
| 2021 | $2,271 | $62,650 | $5,730 | $56,920 |
| 2020 | $2,089 | $55,270 | $4,940 | $50,330 |
| 2019 | $2,068 | $55,270 | $4,940 | $50,330 |
| 2018 | $2,065 | $55,270 | $4,940 | $50,330 |
| 2017 | $1,955 | $51,490 | $4,800 | $46,690 |
| 2016 | $2,009 | $51,490 | $4,800 | $46,690 |
| 2015 | $1,914 | $51,490 | $4,800 | $46,690 |
| 2014 | $953 | $49,160 | $4,800 | $44,360 |
| 2013 | $1,911 | $49,160 | $4,800 | $44,360 |
Source: Public Records
Map
Nearby Homes
- 295 Meachem Rd
- 265 S Meachem Rd
- 265 S Meachem Rd Unit 62
- 265 S Meachem Rd Unit 24
- 265 S Meachem Rd Unit 41
- 265 S Meachem Rd Unit 39
- 141 N Wexford Dr E
- 5225 W Lakeshore Dr
- 3800 W Lakeshore Dr
- 2915 W Rising Sun Rd
- 2915 W Risingsun Rd
- 7723 W Little Portage Rd E
- 2860 W Rising Sun Rd
- 9238 W State Route 163
- 2738 W Columbus St
- 2400 Sandy Ln
- 1805 W Lakeshore Dr Unit 3
- 1805 W Lakeshore Dr
- 162 Oak Ridge Dr
- 51 N Schooner Point Dr
- 5875 West Harbor Rd
- 5875 W Harbor Rd
- 5925 West Harbor Rd
- 5963 West Harbor Rd
- 5855 West Harbor Rd
- 5860 West Harbor Rd
- 12 S Wolfe Rd
- 5980 West Harbor Rd
- 17 S Wolfe Rd
- 5833 West Harbor Rd
- 5812 West Harbor Rd
- 75 S Wolfe Rd
- 91 S Wolfe Rd
- 5780 West Harbor Rd
- 5970 West Harbor Rd
- 107 S Wolfe Rd
- 6039 W Harbor Rd
- 5773 W Harbor Rd
- 5776 West Harbor Rd
- 111 S Wolfe Rd