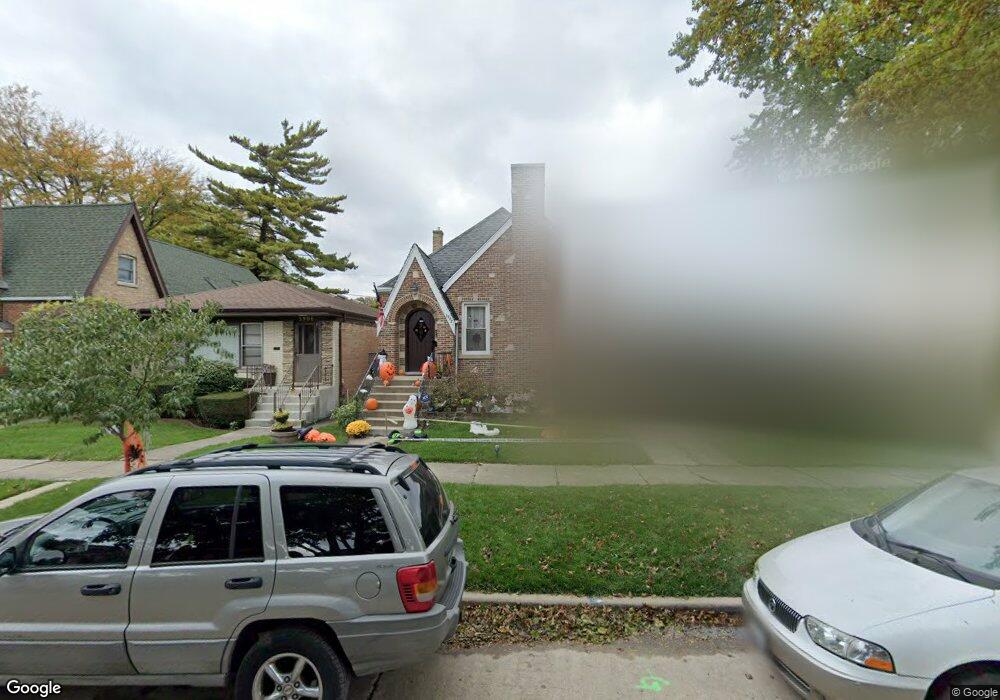
5902 Capulina Ave Morton Grove, IL 60053
Estimated Value: $522,000 - $696,000
4
Beds
2
Baths
2,025
Sq Ft
$305/Sq Ft
Est. Value
About This Home
This home is located at 5902 Capulina Ave, Morton Grove, IL 60053 and is currently estimated at $617,915, approximately $305 per square foot. 5902 Capulina Ave is a home located in Cook County with nearby schools including Park View Elementary School, Niles West High School, and Arie Crown Hebrew Day School.
Ownership History
Date
Name
Owned For
Owner Type
Purchase Details
Closed on
Nov 1, 2007
Sold by
Capota Daniel
Bought by
Soica Jana
Current Estimated Value
Home Financials for this Owner
Home Financials are based on the most recent Mortgage that was taken out on this home.
Original Mortgage
$417,000
Outstanding Balance
$262,064
Interest Rate
6.25%
Mortgage Type
Unknown
Estimated Equity
$355,851
Purchase Details
Closed on
Jan 16, 2004
Sold by
Burns Timothy C and Burns Anny K
Bought by
Capota Daniel
Home Financials for this Owner
Home Financials are based on the most recent Mortgage that was taken out on this home.
Original Mortgage
$255,550
Interest Rate
7.1%
Mortgage Type
Unknown
Purchase Details
Closed on
Aug 3, 1995
Sold by
Burns Timothy C
Bought by
Burns Timothy C and Burns Anny K
Create a Home Valuation Report for This Property
The Home Valuation Report is an in-depth analysis detailing your home's value as well as a comparison with similar homes in the area
Home Values in the Area
Average Home Value in this Area
Purchase History
| Date | Buyer | Sale Price | Title Company |
|---|---|---|---|
| Soica Jana | $555,000 | Mercury Title Company Llc | |
| Soica Jana | $555,000 | Mercury Title Company Llc | |
| Capota Daniel | $269,000 | Rtc | |
| Burns Timothy C | -- | Chicago Title Insurance Co |
Source: Public Records
Mortgage History
| Date | Status | Borrower | Loan Amount |
|---|---|---|---|
| Open | Soica Jana | $417,000 | |
| Closed | Soica Jana | $417,000 | |
| Previous Owner | Capota Daniel | $255,550 |
Source: Public Records
Tax History Compared to Growth
Tax History
| Year | Tax Paid | Tax Assessment Tax Assessment Total Assessment is a certain percentage of the fair market value that is determined by local assessors to be the total taxable value of land and additions on the property. | Land | Improvement |
|---|---|---|---|---|
| 2024 | $10,885 | $41,000 | $4,836 | $36,164 |
| 2023 | $10,342 | $41,000 | $4,836 | $36,164 |
| 2022 | $10,342 | $41,000 | $4,836 | $36,164 |
| 2021 | $8,297 | $29,197 | $2,976 | $26,221 |
| 2020 | $8,147 | $29,197 | $2,976 | $26,221 |
| 2019 | $8,225 | $32,806 | $2,976 | $29,830 |
| 2018 | $9,338 | $33,029 | $2,697 | $30,332 |
| 2017 | $9,427 | $33,029 | $2,697 | $30,332 |
| 2016 | $9,149 | $33,029 | $2,697 | $30,332 |
| 2015 | $8,025 | $27,527 | $2,325 | $25,202 |
| 2014 | $8,034 | $27,527 | $2,325 | $25,202 |
| 2013 | $7,832 | $27,527 | $2,325 | $25,202 |
Source: Public Records
Map
Nearby Homes
- 8836 Mansfield Ave
- 6020 Lincoln Ave Unit 407
- 8841 Menard Ave
- 6035 Lincoln Ave
- 8849 Mcvicker Ave
- 8708 Central Ave
- 8918 Parkside Ave
- 6140 Elm St
- 5510 Lincoln Ave Unit B301
- 5510 Lincoln Ave Unit B101
- 5506 Lincoln Ave Unit A117
- 5506 Lincoln Ave Unit A211
- 5506 Lincoln Ave Unit A216
- 6166 Mayfair St Unit 33714
- 5536 Greenwood St
- 8541 Lotus Ave Unit 914
- 5501 Lincoln Ave Unit 203
- 8655 Harms Rd
- 5500 Lincoln Ave Unit 407W
- 5500 Lincoln Ave Unit 116E
- 5900 Capulina Ave
- 5906 Capulina Ave
- 5908 Capulina Ave
- 5910 Capulina Ave
- 8629 Marmora Ave
- 5905 Crain St
- 5901 Crain St
- 5909 Crain St
- 5844 Capulina Ave
- 5918 Capulina Ave
- 5903 Capulina Ave
- 5901 Capulina Ave
- 5907 Capulina Ave
- 5847 Crain St
- 5909 Capulina Ave
- 5838 Capulina Ave
- 5911 Capulina Ave
- 5917 Crain St
- 5922 Capulina Ave
- 5913 Capulina Ave