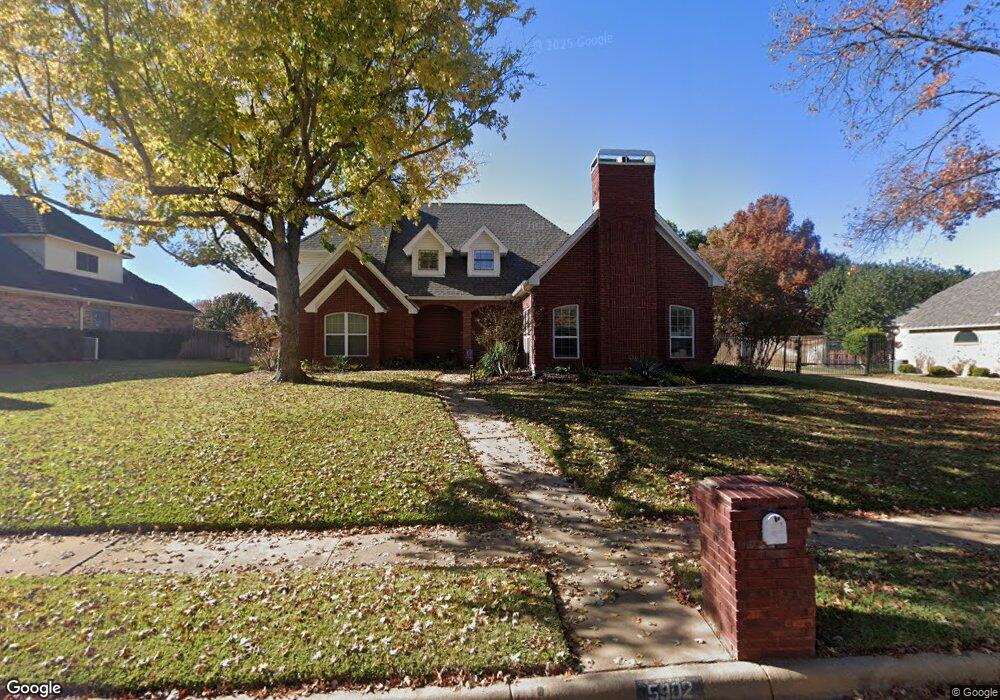
5902 Montford Dr Colleyville, TX 76034
Estimated Value: $856,000 - $907,164
4
Beds
5
Baths
3,236
Sq Ft
$274/Sq Ft
Est. Value
About This Home
This home is located at 5902 Montford Dr, Colleyville, TX 76034 and is currently estimated at $886,041, approximately $273 per square foot. 5902 Montford Dr is a home located in Tarrant County with nearby schools including Glenhope Elementary School, Cross Timbers Middle School, and Grapevine High School.
Ownership History
Date
Name
Owned For
Owner Type
Purchase Details
Closed on
May 1, 2019
Sold by
Cole Willie
Bought by
Cole Willie and Cole Nicole
Current Estimated Value
Purchase Details
Closed on
May 29, 2013
Sold by
Neal Ronald and Neal Jennifer
Bought by
Cole Willde G
Home Financials for this Owner
Home Financials are based on the most recent Mortgage that was taken out on this home.
Original Mortgage
$408,035
Outstanding Balance
$288,826
Interest Rate
3.38%
Mortgage Type
Purchase Money Mortgage
Estimated Equity
$597,215
Purchase Details
Closed on
Aug 17, 2005
Sold by
Miller Marcus and Miller Amy
Bought by
Neal Ronald and Neal Jennifer
Home Financials for this Owner
Home Financials are based on the most recent Mortgage that was taken out on this home.
Original Mortgage
$241,600
Interest Rate
5.65%
Mortgage Type
Fannie Mae Freddie Mac
Purchase Details
Closed on
Oct 16, 2001
Sold by
Allen Harold Gordon and Allen Rhonda Gay
Bought by
Miller Marcus and Miller Amy
Home Financials for this Owner
Home Financials are based on the most recent Mortgage that was taken out on this home.
Original Mortgage
$224,000
Interest Rate
6.85%
Create a Home Valuation Report for This Property
The Home Valuation Report is an in-depth analysis detailing your home's value as well as a comparison with similar homes in the area
Home Values in the Area
Average Home Value in this Area
Purchase History
| Date | Buyer | Sale Price | Title Company |
|---|---|---|---|
| Cole Willie | -- | None Available | |
| Cole Willde G | -- | None Available | |
| Neal Ronald | -- | -- | |
| Miller Marcus | -- | -- |
Source: Public Records
Mortgage History
| Date | Status | Borrower | Loan Amount |
|---|---|---|---|
| Open | Cole Willde G | $408,035 | |
| Previous Owner | Neal Ronald | $241,600 | |
| Previous Owner | Miller Marcus | $224,000 |
Source: Public Records
Tax History Compared to Growth
Tax History
| Year | Tax Paid | Tax Assessment Tax Assessment Total Assessment is a certain percentage of the fair market value that is determined by local assessors to be the total taxable value of land and additions on the property. | Land | Improvement |
|---|---|---|---|---|
| 2025 | $10,826 | $751,499 | $231,550 | $519,949 |
| 2024 | $10,826 | $751,499 | $231,550 | $519,949 |
| 2023 | $12,036 | $761,922 | $231,550 | $530,372 |
| 2022 | $12,811 | $707,052 | $231,550 | $475,502 |
| 2021 | $12,950 | $589,688 | $115,000 | $474,688 |
| 2020 | $12,391 | $557,636 | $115,000 | $442,636 |
| 2019 | $12,969 | $560,925 | $115,000 | $445,925 |
| 2018 | $3,185 | $535,720 | $115,000 | $420,720 |
| 2017 | $12,588 | $532,850 | $105,000 | $427,850 |
| 2016 | $11,773 | $498,344 | $105,000 | $393,344 |
| 2015 | $9,049 | $502,153 | $40,000 | $462,153 |
| 2014 | $9,049 | $390,500 | $40,000 | $350,500 |
Source: Public Records
Map
Nearby Homes
- 5504 Sycamore Dr
- 5613 Versailles Ct
- 1813 Grosvenor Green
- 5404 Miramar Ln
- 5508 Coventry Ct
- 2008 Kyle Ct
- Lot 4 Amelia Ct
- 2602 Pointe Ct
- 2618 Pointe Ct
- 1509 Tinker Rd
- 2906 Cottonwood Ln
- 4214 Hearthside Dr
- 4213 Hearthside Dr
- 3216 Glade Rd
- 5317 Bluebonnet Dr
- 3329 Moss Creek Dr
- 1512 Four Seasons Dr
- 2906 Edgewood Ln
- 3589 Boxwood Dr
- 1315 Hardage Ln
- 5904 Montford Dr
- 5900 Montford Dr
- 5903 Meadowhill Dr
- 5901 Meadowhill Dr
- 5905 Meadowhill Dr
- 5906 Montford Dr
- 5802 Montford Dr
- 5903 Montford Dr
- 5905 Montford Dr
- 5901 Montford Dr
- 5907 Meadowhill Dr
- 5805 Meadowhill Dr
- 5907 Montford Dr
- 5803 Montford Dr
- 5908 Montford Dr
- 5909 Meadowhill Dr
- 5803 Meadowhill Dr
- 5909 Montford Dr
- 5801 Montford Dr
- 5902 Meadowhill Dr