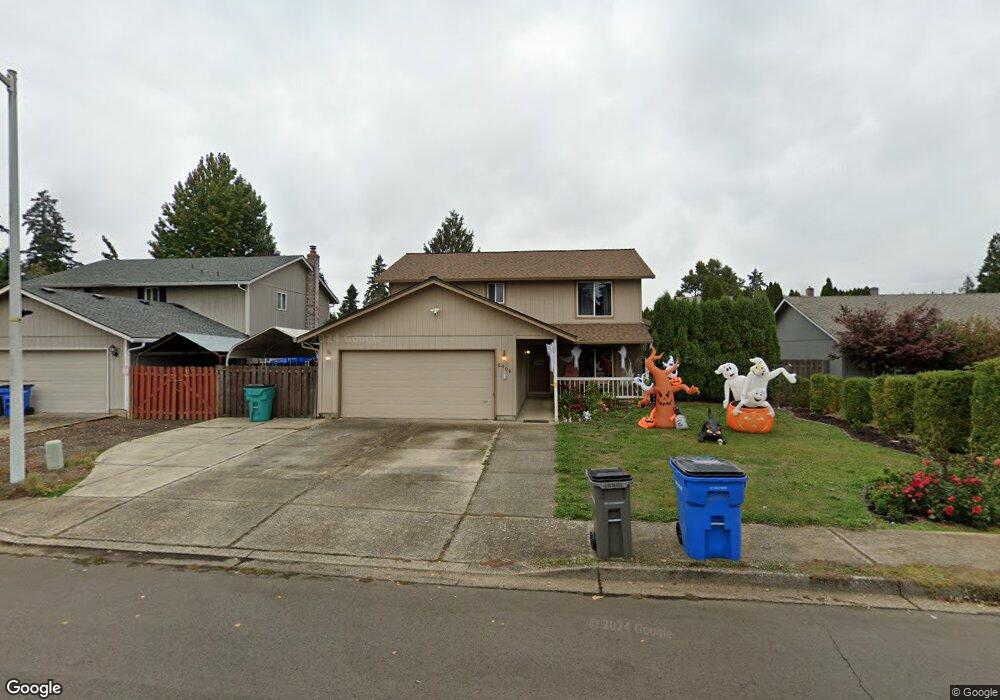
5904 NE 98th St Vancouver, WA 98665
Walnut Grove NeighborhoodEstimated Value: $497,960 - $538,000
4
Beds
3
Baths
2,016
Sq Ft
$259/Sq Ft
Est. Value
About This Home
This home is located at 5904 NE 98th St, Vancouver, WA 98665 and is currently estimated at $522,240, approximately $259 per square foot. 5904 NE 98th St is a home located in Clark County with nearby schools including Pleasant Valley Primary School, Pleasant Valley Middle School, and Prairie High School.
Ownership History
Date
Name
Owned For
Owner Type
Purchase Details
Closed on
Oct 25, 2016
Sold by
Hansen David A
Bought by
Hansen David A and Hansen Katherine K
Current Estimated Value
Home Financials for this Owner
Home Financials are based on the most recent Mortgage that was taken out on this home.
Original Mortgage
$205,525
Outstanding Balance
$165,416
Interest Rate
3.5%
Mortgage Type
New Conventional
Estimated Equity
$356,824
Purchase Details
Closed on
Nov 29, 2010
Sold by
Southern Richard E and Southern Kelly L
Bought by
Hansen David A
Home Financials for this Owner
Home Financials are based on the most recent Mortgage that was taken out on this home.
Original Mortgage
$206,292
Interest Rate
4.5%
Mortgage Type
FHA
Purchase Details
Closed on
Jul 3, 1996
Sold by
Aho Construction
Bought by
Southern Richard E and Southern Kelly L
Home Financials for this Owner
Home Financials are based on the most recent Mortgage that was taken out on this home.
Original Mortgage
$72,500
Interest Rate
8.39%
Create a Home Valuation Report for This Property
The Home Valuation Report is an in-depth analysis detailing your home's value as well as a comparison with similar homes in the area
Home Values in the Area
Average Home Value in this Area
Purchase History
| Date | Buyer | Sale Price | Title Company |
|---|---|---|---|
| Hansen David A | -- | Clark County Title Company | |
| Hansen David A | $215,561 | Stewart Title | |
| Southern Richard E | $108,500 | Charter Title Corp |
Source: Public Records
Mortgage History
| Date | Status | Borrower | Loan Amount |
|---|---|---|---|
| Open | Hansen David A | $205,525 | |
| Closed | Hansen David A | $206,292 | |
| Previous Owner | Southern Richard E | $72,500 |
Source: Public Records
Tax History Compared to Growth
Tax History
| Year | Tax Paid | Tax Assessment Tax Assessment Total Assessment is a certain percentage of the fair market value that is determined by local assessors to be the total taxable value of land and additions on the property. | Land | Improvement |
|---|---|---|---|---|
| 2025 | $3,627 | $457,830 | $192,000 | $265,830 |
| 2024 | $3,322 | $421,328 | $192,000 | $229,328 |
| 2023 | $3,592 | $466,481 | $192,000 | $274,481 |
| 2022 | $3,275 | $428,277 | $192,000 | $236,277 |
| 2021 | $3,059 | $354,048 | $136,850 | $217,198 |
| 2020 | $3,031 | $299,390 | $109,480 | $189,910 |
| 2019 | $2,599 | $288,920 | $109,480 | $179,440 |
| 2018 | $3,146 | $281,152 | $0 | $0 |
| 2017 | $2,691 | $258,406 | $0 | $0 |
| 2016 | $2,595 | $236,428 | $0 | $0 |
| 2015 | $2,656 | $209,617 | $0 | $0 |
| 2014 | -- | $202,862 | $0 | $0 |
| 2013 | -- | $172,044 | $0 | $0 |
Source: Public Records
Map
Nearby Homes
- 9700 NE 59th Ave
- 10005 NE Banton Dr
- 6107 NE Erin Way
- 6307 NE Wilding Rd
- 10909 NE 64th Ct Unit Lot 3
- 11003 NE 64th Ct Unit Lot 7
- 10917 NE 64th Ct
- 11015 NE 64th Ct Unit Lot 10
- 11007 NE 64th Ct Unit Lot 8
- 11101 NE 64th Ct Unit Lot 14
- 5602 NE 102nd St
- 10300 NE 65th Ave
- 9417 NE 52nd Ave
- 11005 NE 55th Ave
- 11013 NE 55th Ave
- 11001 NE 55th Ave
- 6605 NE 107th St
- 10501 NE 68th Ave
- 6617 NE 107th St
- 6908 NE 106th St
- 5908 NE 98th St
- 5900 NE 98th St
- 5905 NE 99th St
- 5909 NE 99th St
- 5901 NE 99th St
- 5912 NE 98th St
- 9705 NE 59th Ave
- 5916 NE 98th St
- 5911 NE 98th St
- 9804 NE 59th Ave
- 9800 NE 59th Ave
- 9808 NE 59th Ave
- 9716 NE 59th Ave
- 9712 NE 59th Ave
- 5915 NE 98th St
- 9708 NE 59th Ave
- 9812 NE 59th Ave
- 9704 NE 59th Ave
- 5920 NE 98th St