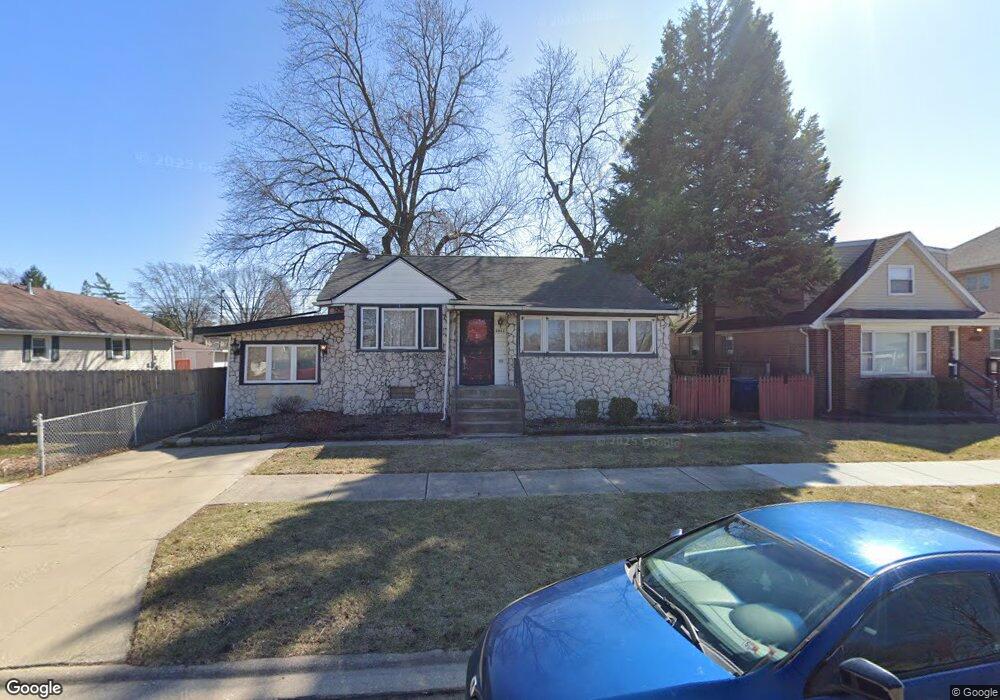
5905 W 90th Place Oak Lawn, IL 60453
Estimated Value: $240,000 - $289,937
--
Bed
--
Bath
1,711
Sq Ft
$159/Sq Ft
Est. Value
About This Home
This home is located at 5905 W 90th Place, Oak Lawn, IL 60453 and is currently estimated at $271,734, approximately $158 per square foot. 5905 W 90th Place is a home located in Cook County with nearby schools including Harnew Elementary School, Simmons Middle School, and Oak Lawn Community High School.
Ownership History
Date
Name
Owned For
Owner Type
Purchase Details
Closed on
Dec 13, 2024
Sold by
Billy Gene Davis Living Trust and Carmody Donna
Bought by
Snead-Johnson Perry Rasheem
Current Estimated Value
Home Financials for this Owner
Home Financials are based on the most recent Mortgage that was taken out on this home.
Original Mortgage
$258,990
Outstanding Balance
$257,083
Interest Rate
7.13%
Mortgage Type
New Conventional
Estimated Equity
$14,651
Purchase Details
Closed on
Nov 17, 2015
Sold by
Davis Billy Gene
Bought by
The Billy Gene Davis Living Trust
Purchase Details
Closed on
May 3, 1996
Sold by
Davis Billy Gene
Bought by
Davis Billy Gene and Auten Hermine
Home Financials for this Owner
Home Financials are based on the most recent Mortgage that was taken out on this home.
Original Mortgage
$30,000
Interest Rate
8.18%
Create a Home Valuation Report for This Property
The Home Valuation Report is an in-depth analysis detailing your home's value as well as a comparison with similar homes in the area
Home Values in the Area
Average Home Value in this Area
Purchase History
| Date | Buyer | Sale Price | Title Company |
|---|---|---|---|
| Snead-Johnson Perry Rasheem | $267,000 | Fidelity National Title | |
| Snead-Johnson Perry Rasheem | $267,000 | Fidelity National Title | |
| The Billy Gene Davis Living Trust | -- | Attorney | |
| Davis Billy Gene | -- | -- |
Source: Public Records
Mortgage History
| Date | Status | Borrower | Loan Amount |
|---|---|---|---|
| Open | Snead-Johnson Perry Rasheem | $258,990 | |
| Closed | Snead-Johnson Perry Rasheem | $258,990 | |
| Previous Owner | Davis Billy Gene | $30,000 |
Source: Public Records
Tax History Compared to Growth
Tax History
| Year | Tax Paid | Tax Assessment Tax Assessment Total Assessment is a certain percentage of the fair market value that is determined by local assessors to be the total taxable value of land and additions on the property. | Land | Improvement |
|---|---|---|---|---|
| 2024 | $2,143 | $11,371 | $2,588 | $8,783 |
| 2023 | $1,596 | $13,035 | $2,588 | $10,447 |
| 2022 | $1,596 | $7,324 | $2,231 | $5,093 |
| 2021 | $1,539 | $7,323 | $2,231 | $5,092 |
| 2020 | $1,488 | $7,323 | $2,231 | $5,092 |
| 2019 | $1,392 | $6,803 | $2,052 | $4,751 |
| 2018 | $1,334 | $6,803 | $2,052 | $4,751 |
| 2017 | $1,348 | $6,803 | $2,052 | $4,751 |
| 2016 | $1,058 | $4,221 | $1,695 | $2,526 |
| 2015 | $1,394 | $5,309 | $1,695 | $3,614 |
| 2014 | $1,182 | $4,221 | $1,695 | $2,526 |
| 2013 | $2,289 | $9,866 | $1,695 | $8,171 |
Source: Public Records
Map
Nearby Homes
- 5840 W 90th St
- 9100 Lynwood Dr
- 5905 W 89th St
- 5831 W 89th St
- 9001 Major Ave
- 8803 Austin Ave
- 8743 Austin Ave
- 8848 Meade Ave
- 9258 Austin Ave
- 5746 W 88th St
- 5649 W 87th Place
- 5555 W 90th St
- 8646 Menard Ave
- 8762 Central Ave
- 8758 Central Ave
- 9228 S 55th Ct
- 6313 W 89th Place
- 5500 W 90th St
- 9420 Massasoit Ave
- 9239 S 55th Ct
- 5905 W 90th Place
- 5905 W 90th Place
- 5907 W 90th Place
- 5901 W 90th Place
- 5921 W 90th Place
- 5904 W 91st St
- 5904 W 91st St
- 5914 W 91st St
- 5914 W 91st St
- 5914 W 91st St
- 5900 W 91st St
- 5925 W 90th Place
- 5925 W 90th Place
- 5859 W 90th Place
- 5929 W 90th St
- 5929 90th Place
- 5904 W 90th Place
- 5914 W 90th Place
- 5900 W 90th Place
- 5920 W 91st St