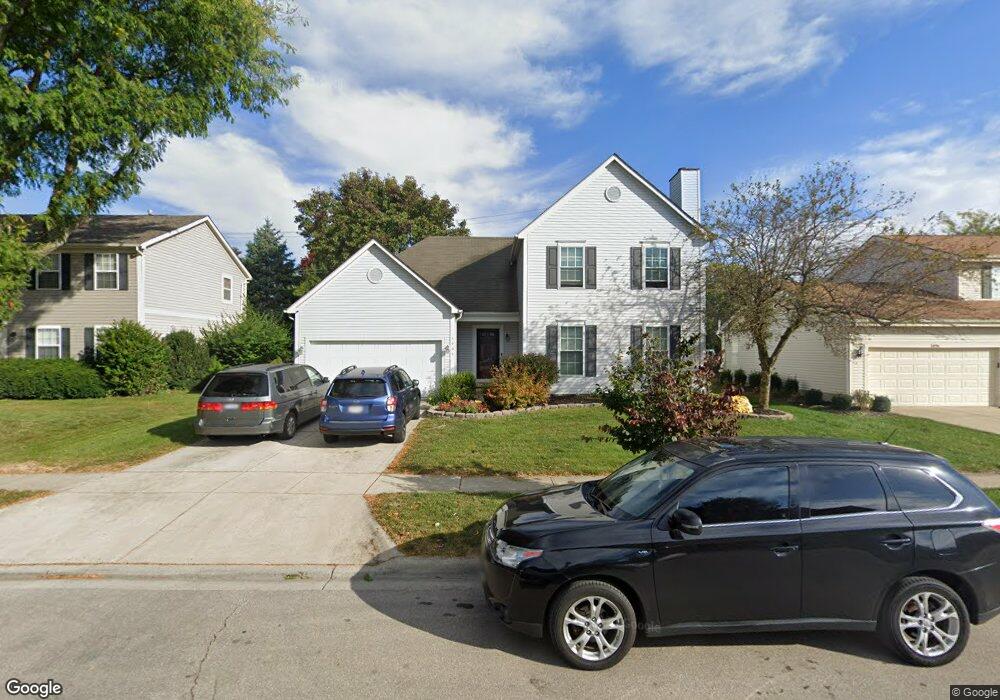
5906 Northcliff Blvd Dublin, OH 43016
Estimated Value: $471,000 - $495,863
4
Beds
3
Baths
2,135
Sq Ft
$227/Sq Ft
Est. Value
About This Home
This home is located at 5906 Northcliff Blvd, Dublin, OH 43016 and is currently estimated at $483,966, approximately $226 per square foot. 5906 Northcliff Blvd is a home located in Franklin County with nearby schools including Indian Run Elementary School, John Sells Middle School, and Dublin Coffman High School.
Ownership History
Date
Name
Owned For
Owner Type
Purchase Details
Closed on
Feb 1, 2023
Sold by
Chu Tao A and Jin Lan
Bought by
Chu Family Trust
Current Estimated Value
Purchase Details
Closed on
May 17, 2001
Sold by
Vanderboegh Paul D and Vanderboegh Debra J
Bought by
Chu Tao A and Chu Jin Lan
Home Financials for this Owner
Home Financials are based on the most recent Mortgage that was taken out on this home.
Original Mortgage
$70,000
Interest Rate
7.02%
Purchase Details
Closed on
Feb 22, 1995
Sold by
Borror Corp
Bought by
Vanderboegh Paul D and Vanderboegh Debra J
Home Financials for this Owner
Home Financials are based on the most recent Mortgage that was taken out on this home.
Original Mortgage
$104,870
Interest Rate
8.5%
Mortgage Type
New Conventional
Purchase Details
Closed on
Jan 17, 1992
Create a Home Valuation Report for This Property
The Home Valuation Report is an in-depth analysis detailing your home's value as well as a comparison with similar homes in the area
Home Values in the Area
Average Home Value in this Area
Purchase History
| Date | Buyer | Sale Price | Title Company |
|---|---|---|---|
| Chu Family Trust | -- | Simplifile | |
| Chu Tao A | $176,300 | Midland Celtic Title | |
| Vanderboegh Paul D | $170,874 | -- | |
| -- | $119,600 | -- |
Source: Public Records
Mortgage History
| Date | Status | Borrower | Loan Amount |
|---|---|---|---|
| Previous Owner | Chu Tao A | $70,000 | |
| Previous Owner | Vanderboegh Paul D | $104,870 |
Source: Public Records
Tax History Compared to Growth
Tax History
| Year | Tax Paid | Tax Assessment Tax Assessment Total Assessment is a certain percentage of the fair market value that is determined by local assessors to be the total taxable value of land and additions on the property. | Land | Improvement |
|---|---|---|---|---|
| 2024 | $8,955 | $137,840 | $37,910 | $99,930 |
| 2023 | $8,831 | $137,840 | $37,910 | $99,930 |
| 2022 | $7,247 | $103,390 | $26,740 | $76,650 |
| 2021 | $7,264 | $103,390 | $26,740 | $76,650 |
| 2020 | $7,324 | $103,390 | $26,740 | $76,650 |
| 2019 | $6,662 | $83,170 | $21,390 | $61,780 |
| 2018 | $6,571 | $83,170 | $21,390 | $61,780 |
| 2017 | $6,200 | $83,170 | $21,390 | $61,780 |
| 2016 | $6,411 | $80,750 | $18,690 | $62,060 |
| 2015 | $6,452 | $80,750 | $18,690 | $62,060 |
| 2014 | $6,460 | $80,750 | $18,690 | $62,060 |
| 2013 | $3,287 | $80,745 | $18,690 | $62,055 |
Source: Public Records
Map
Nearby Homes
- 6183 Donegan Way Unit 8
- 5963 Sandy Rings Ln
- 5781 Wilcox Rd
- 6214 Donegan Way
- 6295 Donegan Way
- 5839 Castleknock Rd
- 5720 Sandymount Dr
- 5613 Brighton Hill Ln
- 5950 Varwyne Dr
- 0 Rings Rd
- 5856 Locbury Ln Unit R
- 6124 Inishmore Ln
- 6247 Hampton Green Place Unit D
- 6049 Craughwell Ln Unit 4
- 6259 Hampton Green Place Unit 8B
- 6228 Rings Rd
- 6117 Craughwell Ln
- 6658 Traquair Place
- 7154 Drummore Ct
- 7162 Drummore Ct
- 5896 Northcliff Blvd
- 5914 Northcliff Blvd
- 6071 Ashleylynn Ct
- 5888 Northcliff Blvd
- 6072 Ashleylynn Ct
- 5924 Northcliff Blvd
- 6073 Ashleylynn Ct
- 5915 Northcliff Blvd
- 5919 Northcliff Blvd
- 5897 Northcliff Blvd
- 5880 Northcliff Blvd
- 5923 Northcliff Blvd
- 6076 Ashleylynn Ct
- 5889 Northcliff Blvd
- 6063 Heather Glen Blvd
- 6075 Ashleylynn Ct
- 5879 Northcliff Blvd
- 6073 Heather Glen Blvd
- 5868 Northcliff Blvd
- 6082 Ashleylynn Ct