Estimated Value: $333,000 - $374,000
4
Beds
2
Baths
1,450
Sq Ft
$245/Sq Ft
Est. Value
About This Home
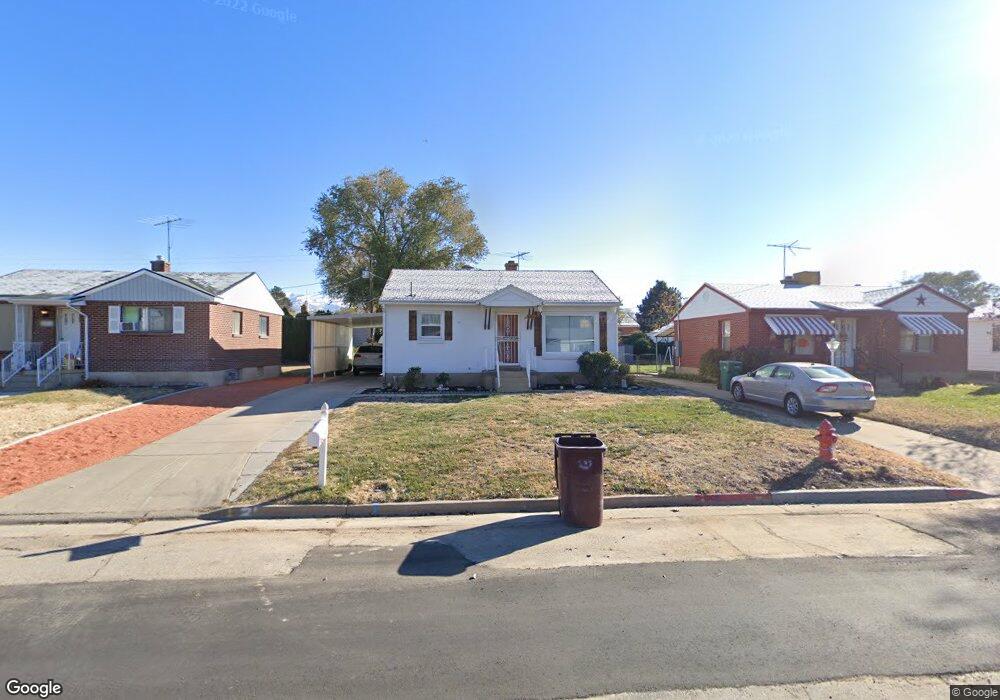
This home is located at 5906 S 2625 W, Roy, UT 84067 and is currently estimated at $355,856, approximately $245 per square foot. 5906 S 2625 W is a home located in Weber County with nearby schools including Roy Elementary School, Roy Junior High School, and Roy High School.
Ownership History
Date
Name
Owned For
Owner Type
Purchase Details
Closed on
Nov 17, 2020
Sold by
Galvan Christian
Bought by
Galvan Christian and Barajas Gil Karla
Current Estimated Value
Home Financials for this Owner
Home Financials are based on the most recent Mortgage that was taken out on this home.
Original Mortgage
$206,500
Outstanding Balance
$183,756
Interest Rate
2.8%
Mortgage Type
New Conventional
Estimated Equity
$172,100
Purchase Details
Closed on
Jul 29, 2019
Sold by
Rosales Yuridia Delgadillo
Bought by
Galvin Christian
Home Financials for this Owner
Home Financials are based on the most recent Mortgage that was taken out on this home.
Original Mortgage
$204,232
Interest Rate
4.4%
Mortgage Type
FHA
Purchase Details
Closed on
Jul 14, 2016
Bought by
Yuridia Delgadillo Rosales
Home Financials for this Owner
Home Financials are based on the most recent Mortgage that was taken out on this home.
Original Mortgage
$137,464
Interest Rate
3.42%
Purchase Details
Closed on
Feb 22, 2012
Sold by
Carpio Emma M
Bought by
Carpio Emma Eliria
Create a Home Valuation Report for This Property
The Home Valuation Report is an in-depth analysis detailing your home's value as well as a comparison with similar homes in the area
Home Values in the Area
Average Home Value in this Area
Purchase History
| Date | Buyer | Sale Price | Title Company |
|---|---|---|---|
| Galvan Christian | -- | Us Title Insurance Agency | |
| Galvin Christian | -- | Inwest Title Services Layton | |
| Yuridia Delgadillo Rosales | -- | -- | |
| Carpio Emma Eliria | -- | None Available |
Source: Public Records
Mortgage History
| Date | Status | Borrower | Loan Amount |
|---|---|---|---|
| Open | Galvan Christian | $206,500 | |
| Closed | Galvin Christian | $204,232 | |
| Previous Owner | Yuridia Delgadillo Rosales | $137,464 | |
| Previous Owner | Yuridia Delgadillo Rosales | -- |
Source: Public Records
Tax History Compared to Growth
Tax History
| Year | Tax Paid | Tax Assessment Tax Assessment Total Assessment is a certain percentage of the fair market value that is determined by local assessors to be the total taxable value of land and additions on the property. | Land | Improvement |
|---|---|---|---|---|
| 2025 | $2,055 | $315,707 | $95,215 | $220,492 |
| 2024 | $1,987 | $168,849 | $52,376 | $116,473 |
| 2023 | $1,919 | $163,350 | $53,638 | $109,712 |
| 2022 | $2,137 | $190,300 | $49,858 | $140,442 |
| 2021 | $1,738 | $253,000 | $58,268 | $194,732 |
| 2020 | $1,531 | $203,000 | $58,268 | $144,732 |
| 2019 | $1,491 | $186,000 | $34,683 | $151,317 |
| 2018 | $1,315 | $152,000 | $30,008 | $121,992 |
| 2017 | $1,211 | $130,000 | $30,008 | $99,992 |
| 2016 | $1,175 | $67,783 | $17,228 | $50,555 |
| 2015 | $1,021 | $59,144 | $19,813 | $39,331 |
| 2014 | $988 | $56,264 | $14,630 | $41,634 |
Source: Public Records
Map
Nearby Homes
- 2587 W 5750 S
- 2672 W 5750 S
- 5810 S 2550 W
- 2571 W 5725 S
- 2829 W 5925 S
- 2646 W 5625 S Unit M-2646
- 2907 W 5775 S
- 484 W 2650 N
- 480 W 2650 N
- 2635 N 500 W Unit 45
- 2612 N 525 W
- 2486 N 690 W
- 2593 N 500 W Unit 56
- 2602 N 2125 W
- 2537 N 1220 W
- 3009 W 6000 S
- 2778 W 5550 S Unit 28
- 428 W 2650 N
- 2382 N 770 W
- 5643 S 2200 W