Estimated Value: $966,000 - $1,100,287
About This Home
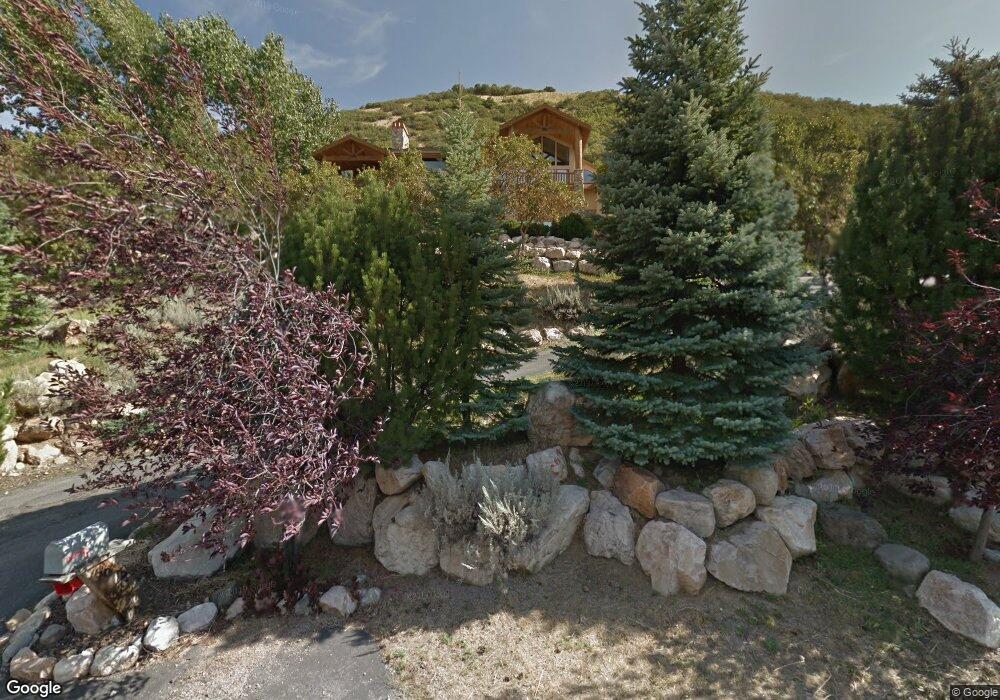
This home is located at 5908 Spring Canyon Rd, Ogden, UT 84403 and is currently estimated at $1,021,072, approximately $172 per square foot. 5908 Spring Canyon Rd is a home located in Weber County with nearby schools including Uintah School, South Ogden Junior High School, and Bonneville High School.
Ownership History
We collect this data history from publicly available records. To have your information removed, we recommend requesting removal directly through your county’s website.
Purchase Details
Purchase Details
Home Financials for this Owner
Home Financials are based on the most recent Mortgage that was taken out on this home.Purchase Details
Home Financials for this Owner
Home Financials are based on the most recent Mortgage that was taken out on this home.Purchase History
We collect this data history from publicly available records. To have your information removed, we recommend requesting removal directly through your county’s website.
| Date | Buyer | Sale Price | Title Company |
|---|---|---|---|
| -- | None Available | ||
| -- | Metro National Title | ||
| -- | Mountain View Title | ||
| -- | Mountain View Title |
Mortgage History
We collect this data history from publicly available records. To have your information removed, we recommend requesting removal directly through your county’s website.
| Date | Status | Borrower | Loan Amount |
|---|---|---|---|
| Open | $469,000 | ||
| Previous Owner | $170,500 |
Tax History
We collect this data history from publicly available records. To have your information removed, we recommend requesting removal directly through your county’s website.
| Year | Tax Paid | Tax Assessment Tax Assessment Total Assessment is a certain percentage of the fair market value that is determined by local assessors to be the total taxable value of land and additions on the property. | Land | Improvement |
|---|---|---|---|---|
| 2025 | $6,646 | $1,023,654 | $324,177 | $699,477 |
| 2024 | $6,368 | $549,999 | $178,297 | $371,702 |
| 2023 | $6,382 | $607,750 | $178,226 | $429,524 |
| 2022 | $6,314 | $557,700 | $137,105 | $420,595 |
| 2021 | $5,414 | $793,000 | $184,407 | $608,593 |
| 2020 | $5,070 | $678,000 | $89,739 | $588,261 |
| 2019 | $4,824 | $617,000 | $82,759 | $534,241 |
| 2018 | $4,981 | $616,000 | $82,759 | $533,241 |
| 2017 | $4,875 | $583,000 | $82,759 | $500,241 |
| 2016 | $4,237 | $278,779 | $47,937 | $230,842 |
| 2015 | $4,168 | $270,506 | $42,403 | $228,103 |
| 2014 | $4,343 | $276,509 | $42,403 | $234,106 |
Map
- 6069 S 2900 E
- 2686 Bonneville Terrace Dr
- 2632 E 6025 S
- 6385 S Larry Way Unit 135
- 6313 Bybee Dr
- 2340 E 5950 S
- 708 E Edgewood
- 6548 Bybee Dr Unit 3
- 2701 E 6425 S
- 2291 E Parkside Cir
- 2288 E Parkside Cir
- 2237 E Parkside Cir
- 6265 S 2225 E
- 2342 E Combe Rd
- 5538 Elderberry Ct
- 1963 Cherokee Cir
- 5227 S Ridgedale Dr
- 5171 S Ridgedale Dr
- 5756 Willow Wood Ln
- 5973 S South Weber Dr
- 5894 Spring Canyon Rd
- 5878 Spring Canyon Rd
- 5901 Spring Canyon Rd
- 5864 S 2950 St E
- 5924 Spring Canyon Rd
- 5924 Spring Canyon Rd Unit 11
- 5913 Spring Canyon Rd
- 5864 Spring Canyon Rd
- 5885 S 2950 St E
- 5885 Spring Canyon Rd
- 5925 Spring Canyon Rd
- 5867 S 2925 E
- 5848 S 2950 St E
- 5848 Spring Canyon Rd
- 5848 Spring Canyon Rd Unit 16
- 5945 Spring Canyon Rd
- 5849 S 2925 E
- 5877 S 2925 E
- 5944 Spring Canyon Rd
- 5944 S Spring Canyon Rd E Unit 10
Ask me questions while you tour the home.